From First Click
to Full Control.
Alro Analytics isn't just a tool — it's the system that shapes your daily routine. Personalize, connect, plan, execute, review, and grow. Here's how.
Make It Yours
Before you trade a single lot, build the workspace that fits your style. Choose your KPIs, arrange your widgets, pick your colors — and save it as a template you'll open every morning.
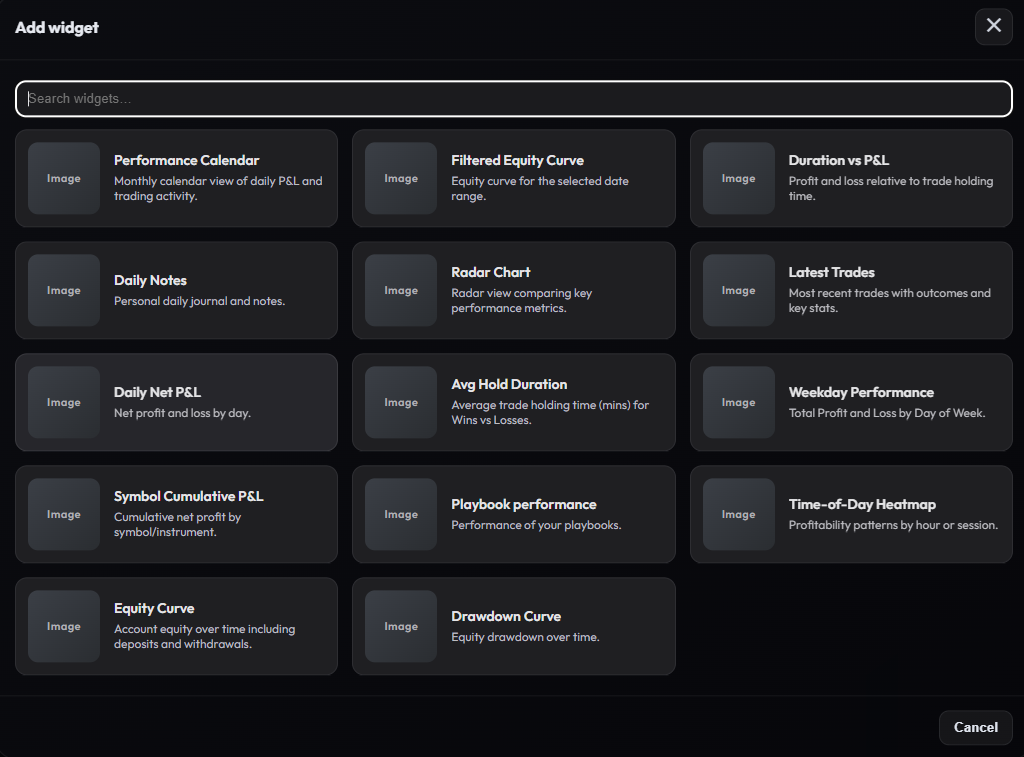
Drag & Drop Widgets
15+ widgets — KPIs, equity curves, calendars, trade tables. Move, resize, and stack them exactly how you want.
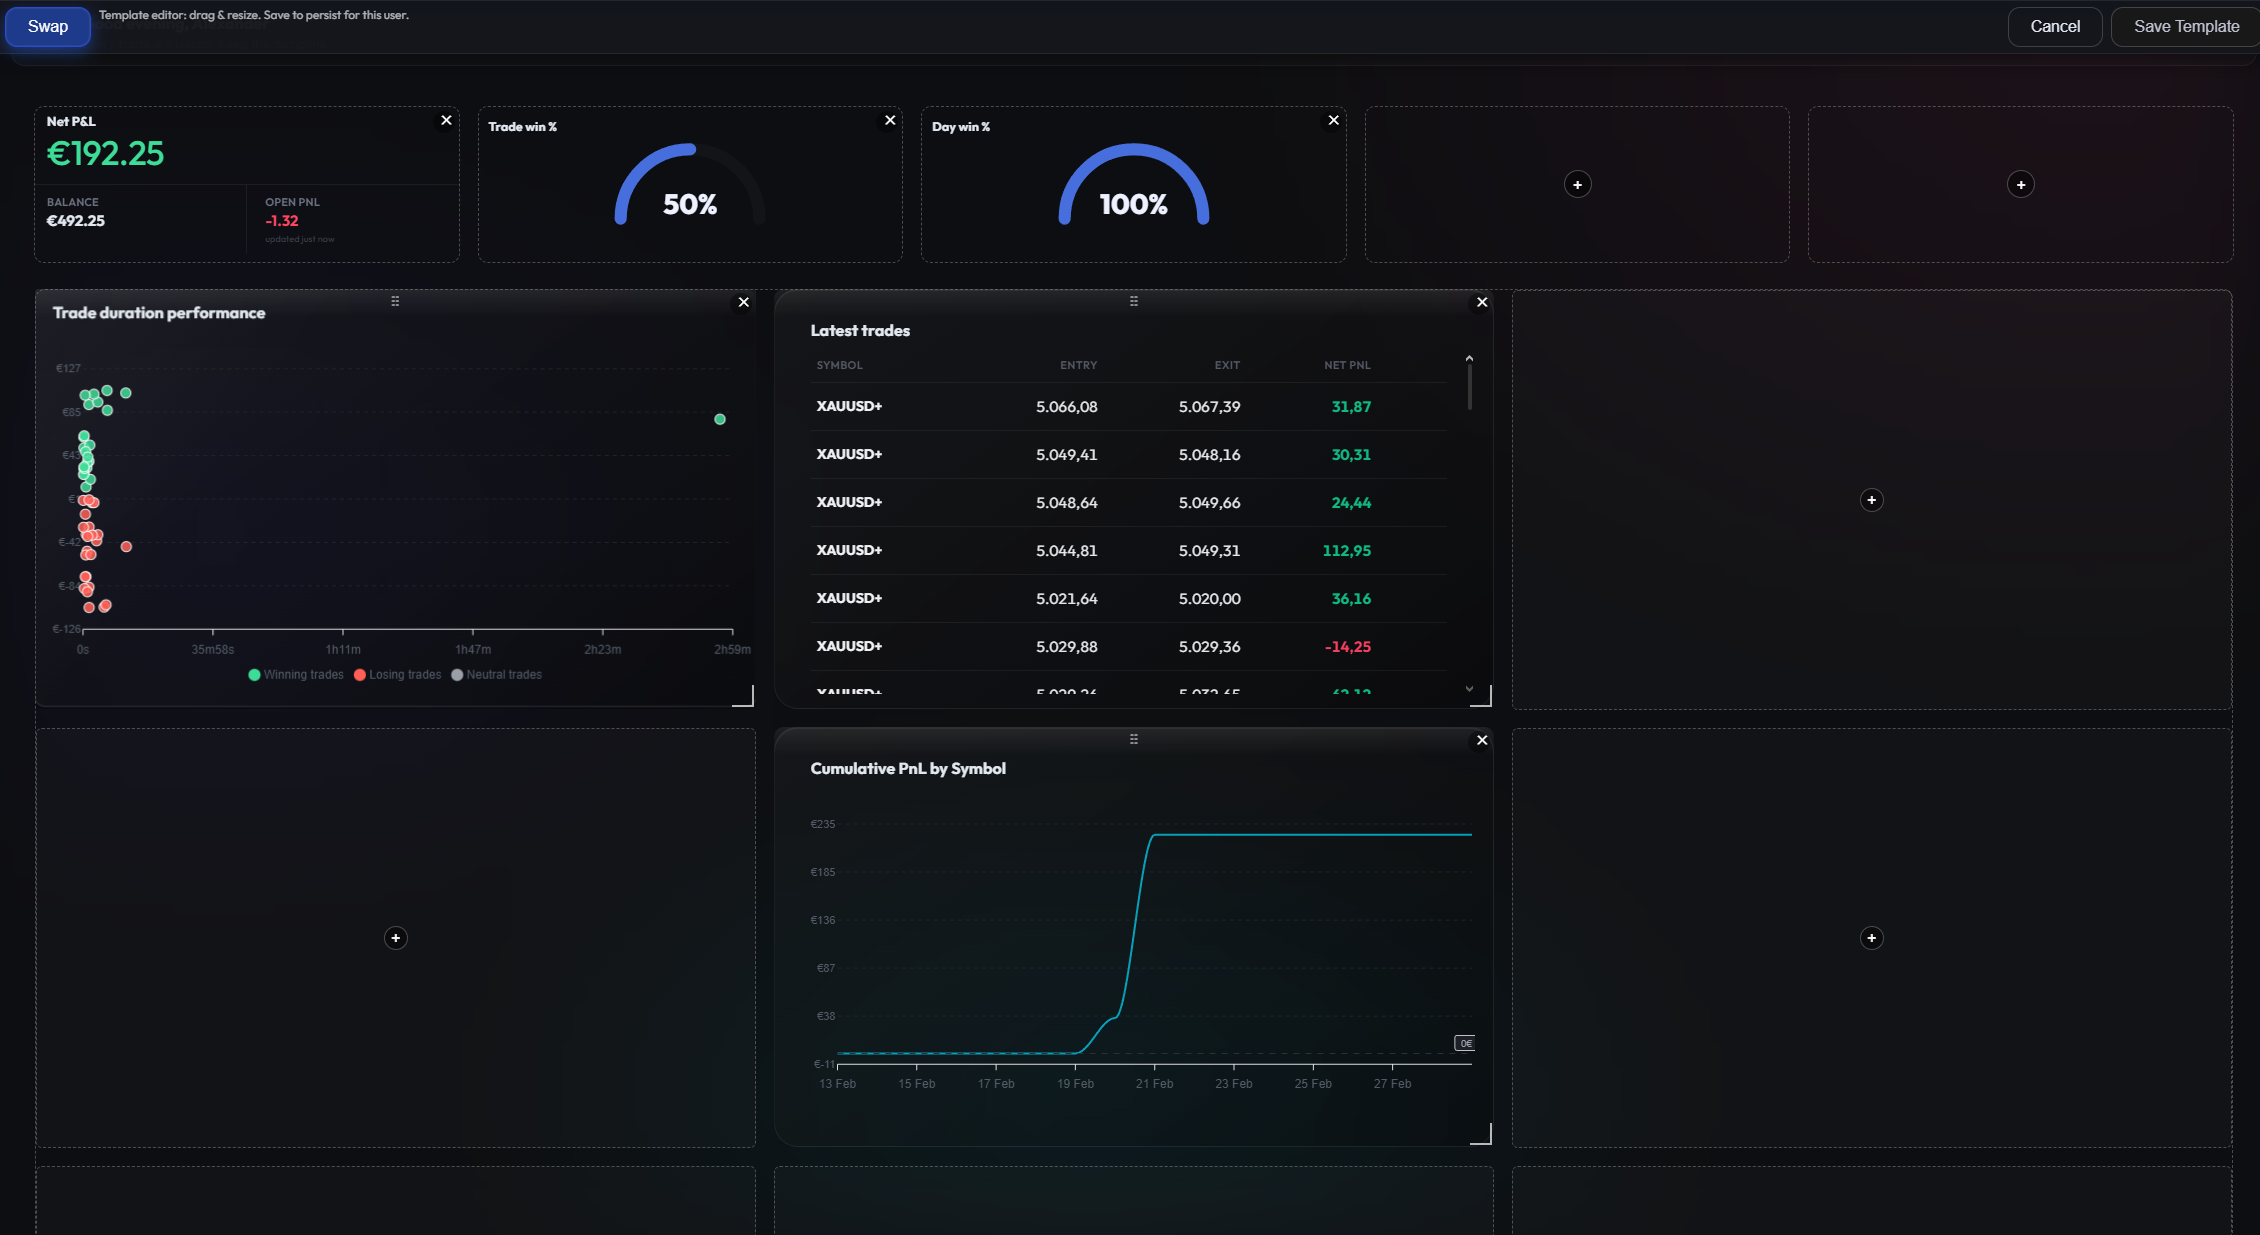
Saveable Templates
Pre-market, live session, review mode — save a layout for each context and switch with one click.
Full Theme Editor
30+ CSS variables, named presets, custom colors. A workspace that looks & feels like yours.
Your workspace is ready. Now let's bring in your trades.
Connect Once. Sync Everything.
Choose how your trades enter the system. Add them manually for full control — or connect your broker and let Alro handle the rest.
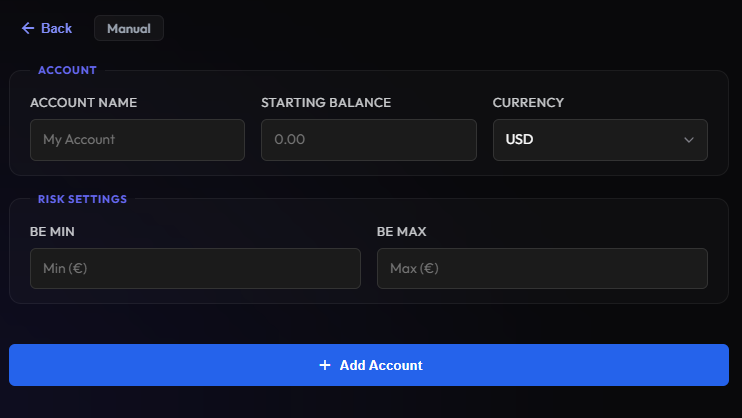
Manual Account
Full control. Add trades yourself, log every detail manually. Perfect for prop-firm traders or multiple strategy accounts.
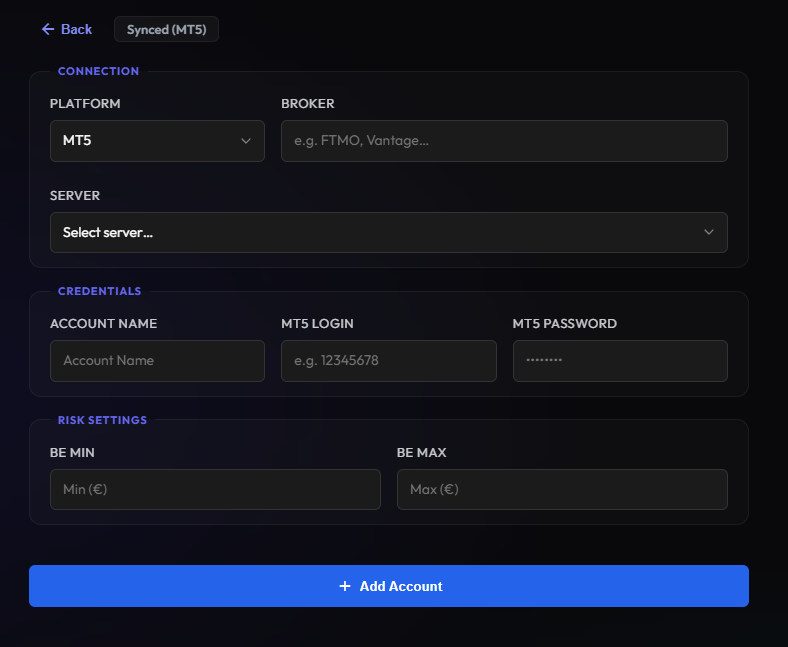
Synced Account
Enter your broker credentials with your investor password. From that moment, everything is automatic — equity, deposits, withdrawals, and every single trade.
Trades are flowing in. Time to see the full picture.
Your Data. Every Angle.
This is where your dashboard comes alive. Every widget updates in real-time — equity curves, P&L breakdowns, the calendar, skill radars. Filter by account, symbol, playbook, or time. Find what works and what doesn't.
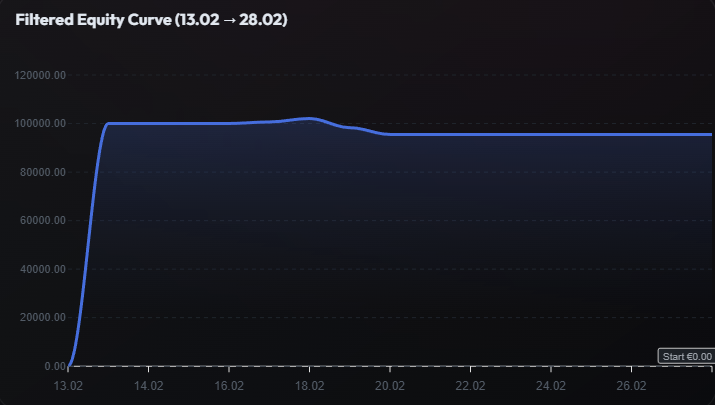
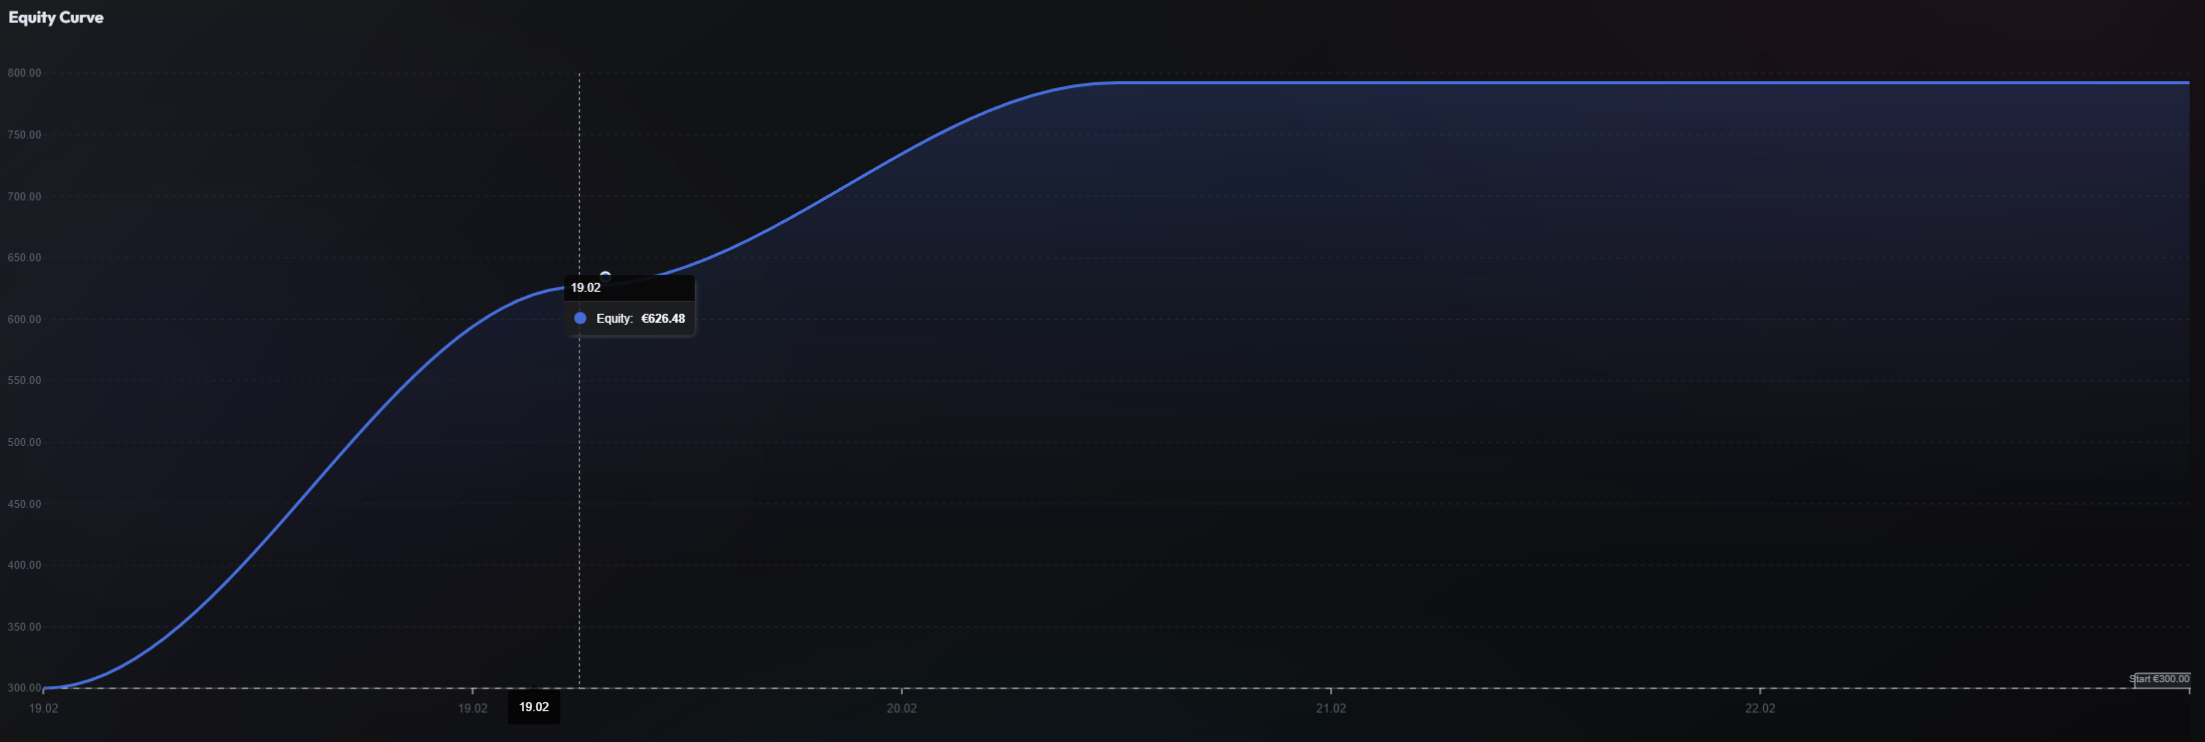
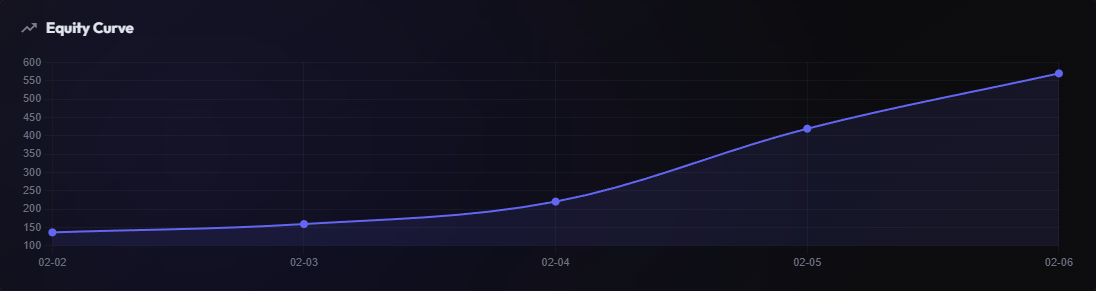
Equity Curve
Filter by account, symbol, playbook, or date range. See your growth unfold in real time.
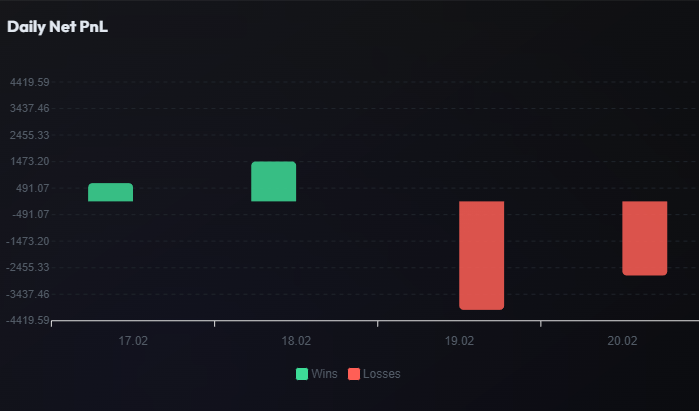
Daily Net P&L
Spot streaks and turning points at a glance.
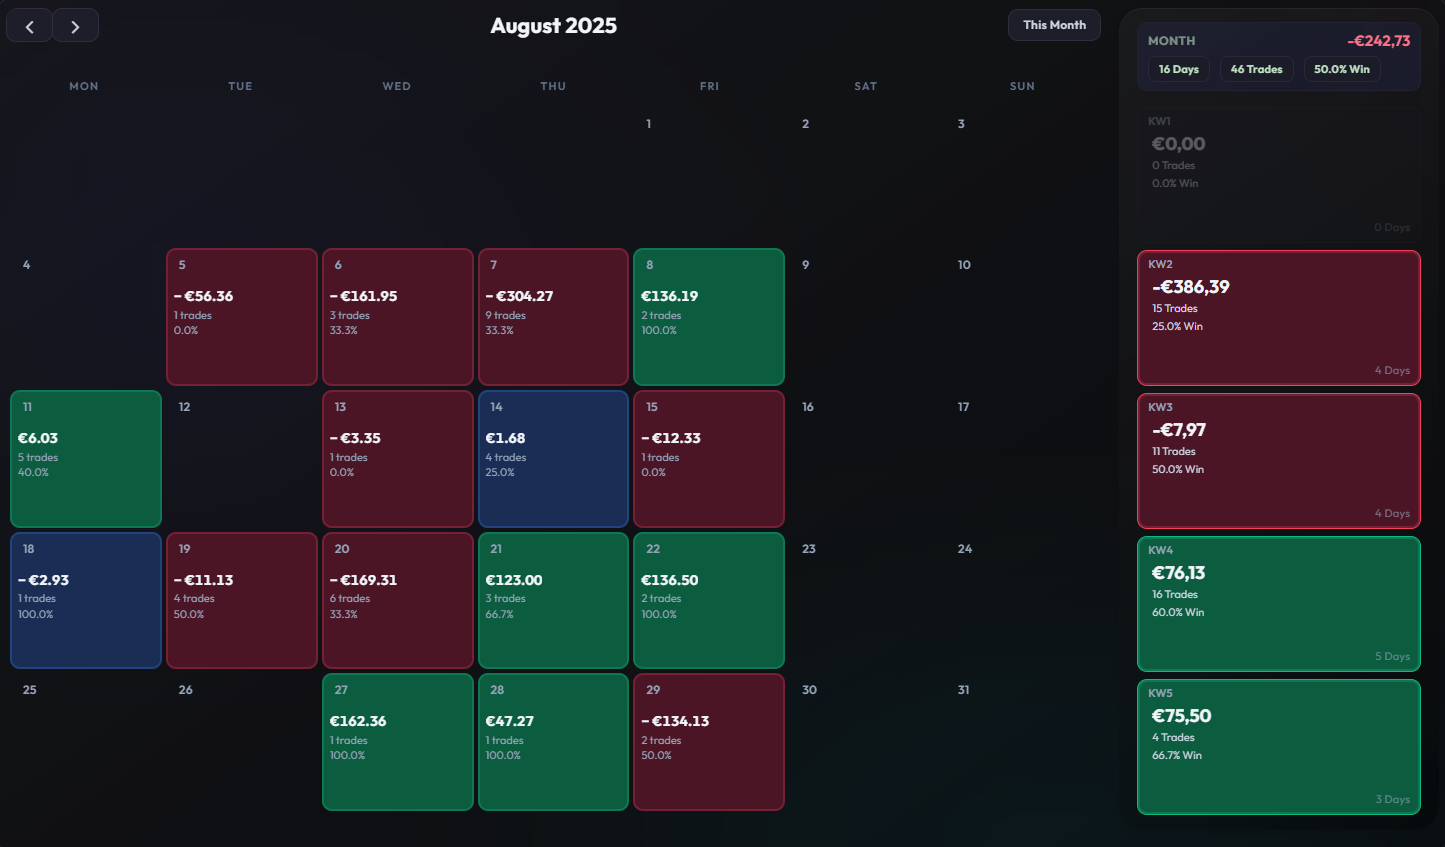
Trading Calendar
Monthly heatmap. Click any day to drill into individual trades.
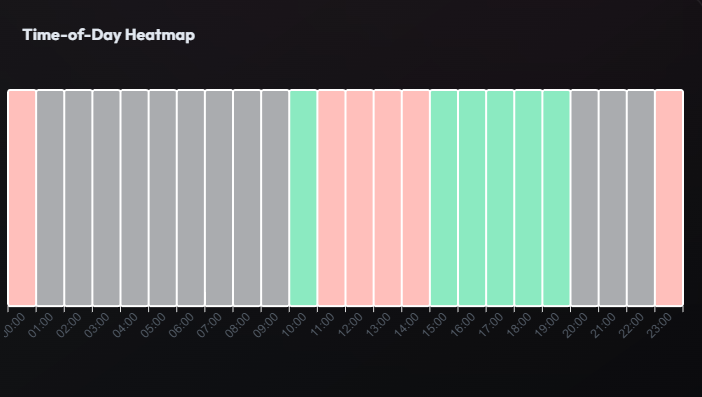
Time-of-Day Heatmap
Discover when you trade best.
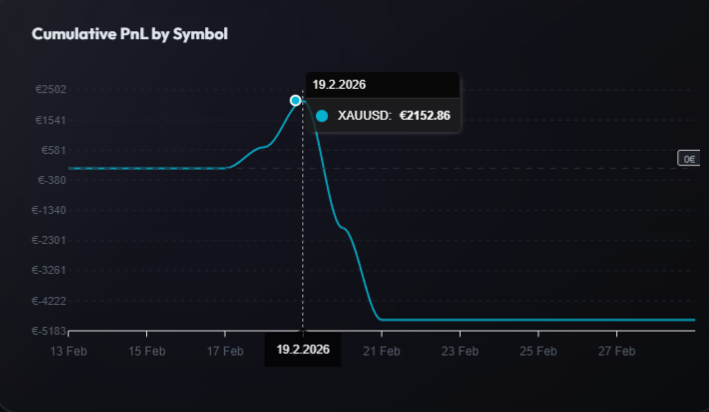
Symbol Breakdown
See where profits come from — and where you burn capital.
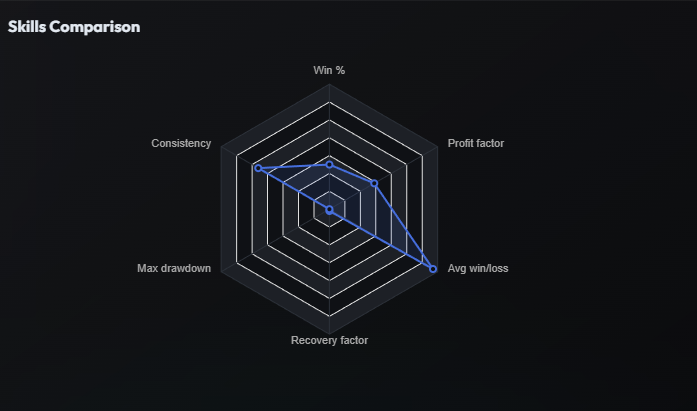
Skill Radar
6-axis assessment: Win Rate, Profit Factor, Recovery, Drawdown, Consistency, W/L Ratio.
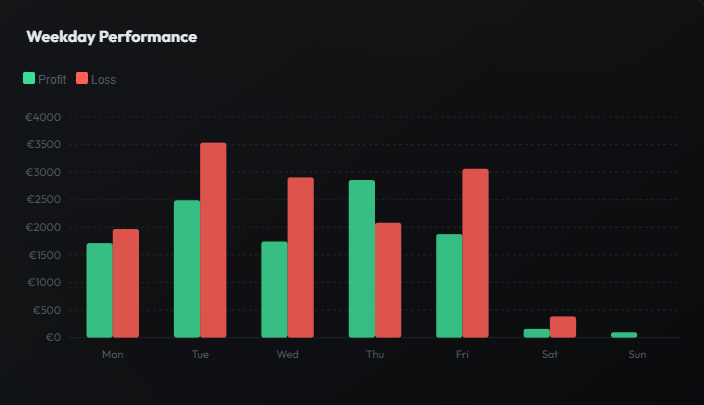
Weekly Performance
Track progress week by week.
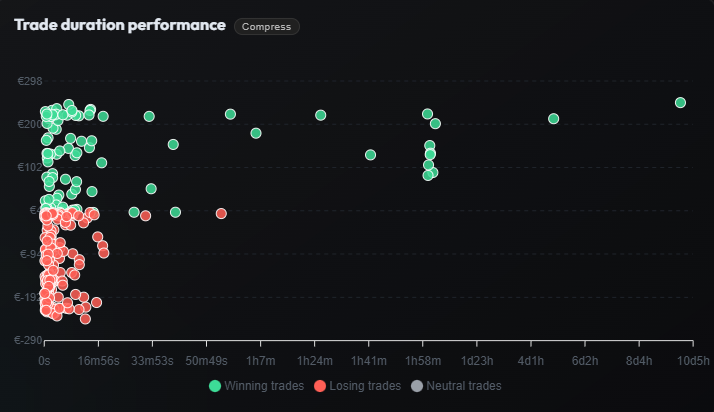
Trade Duration
See how hold time impacts your P&L.
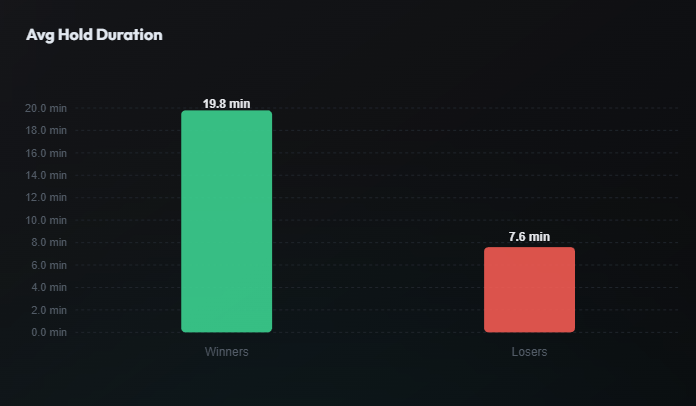
Average Hold Time
Compare hold times across wins and losses.
Data tells the past. Now let's shape tomorrow.
Structure Your Trading Day
Pros don't wing it. Build a morning routine, plan every trade with a built-in risk-to-reward calculator, attach charts, and link your plans directly to executed trades.
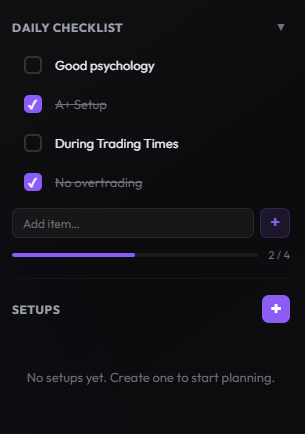
Morning Checklist
Create your personalized daily routine. Check it off every morning before you even look at a chart. Build the discipline that compounds over months.
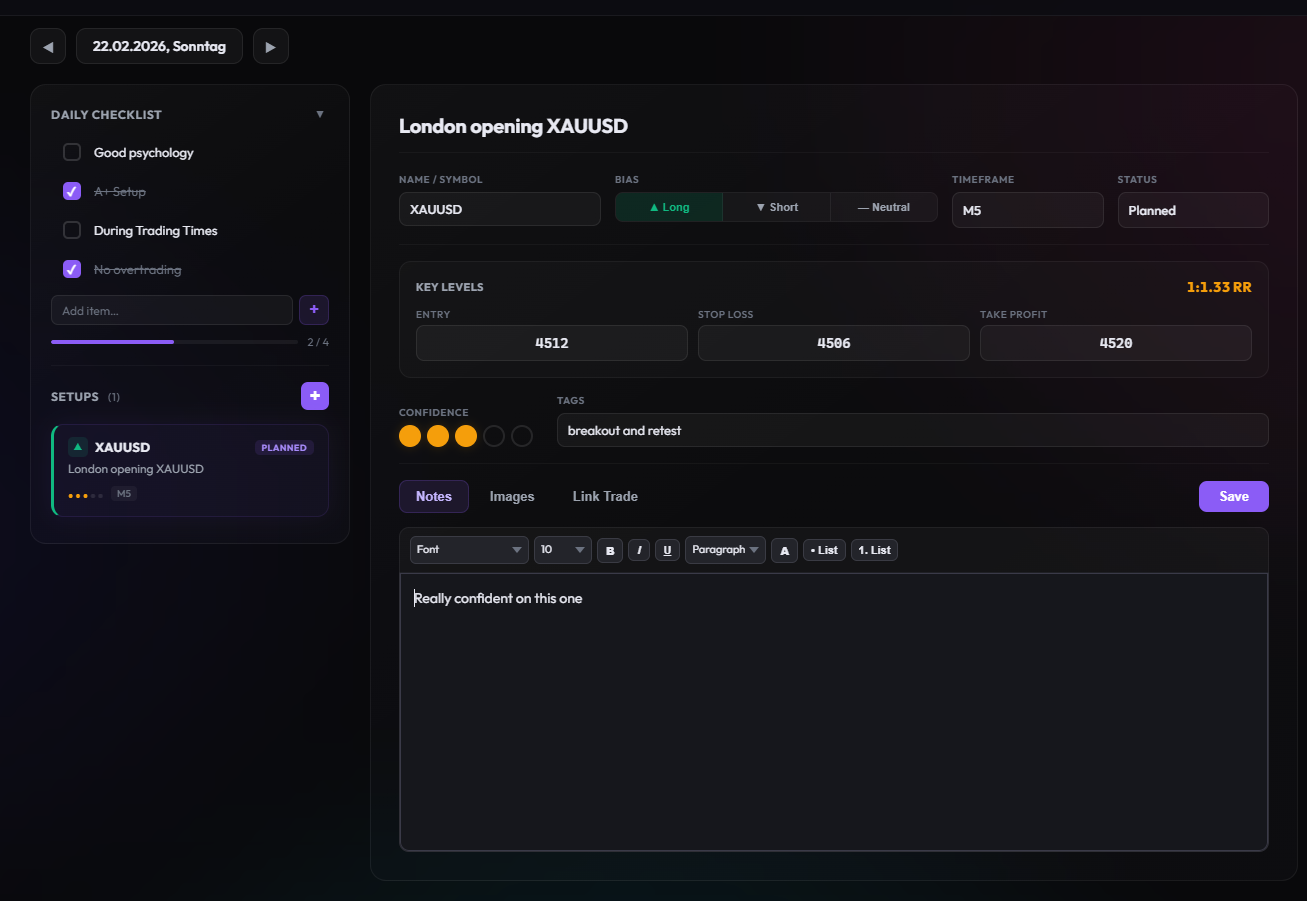
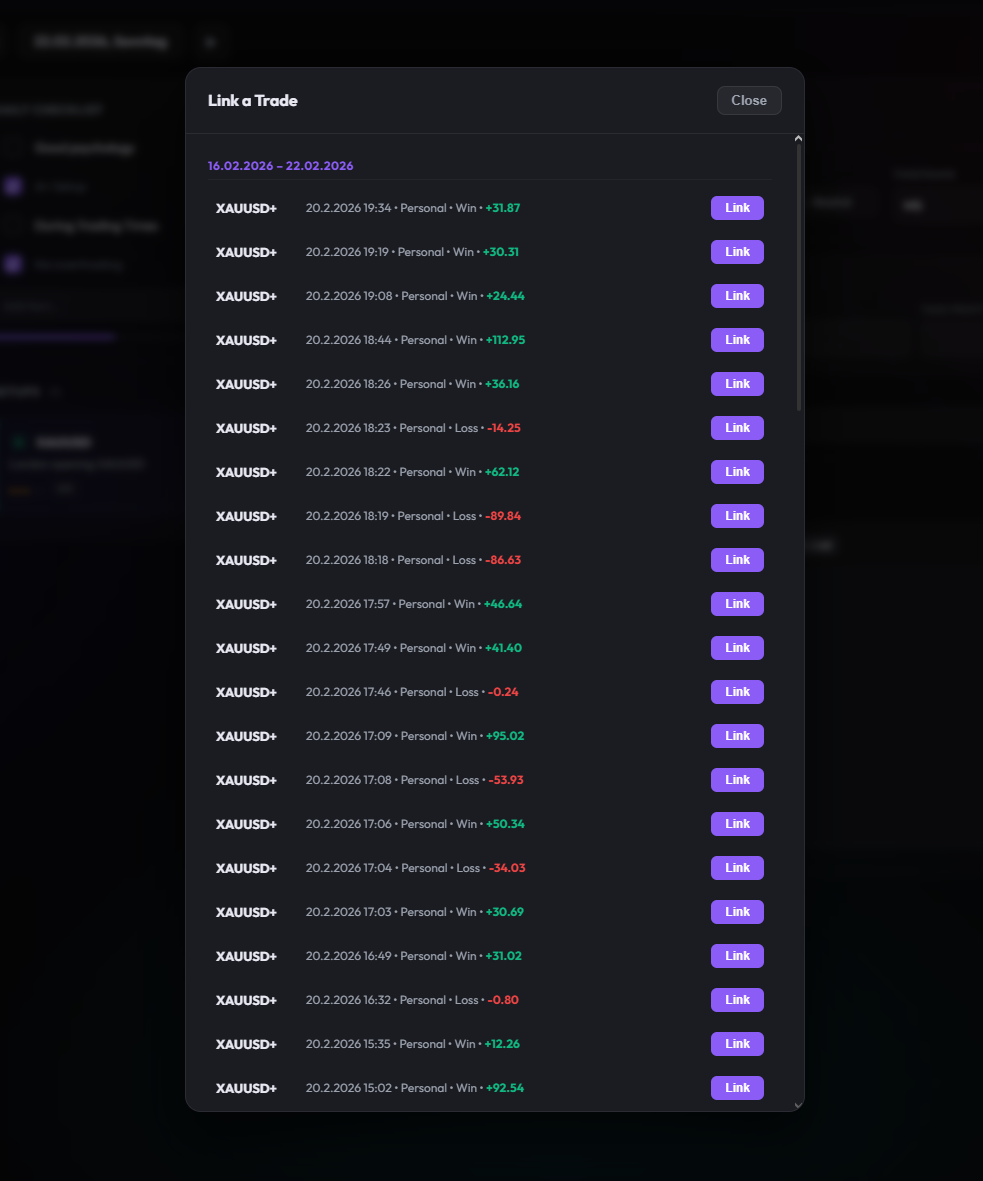
Plan Your Trades
Set bias, targets, and confidence. Use the built-in R:R calculator, attach charts and screenshots, and link playbooks — all before you execute.
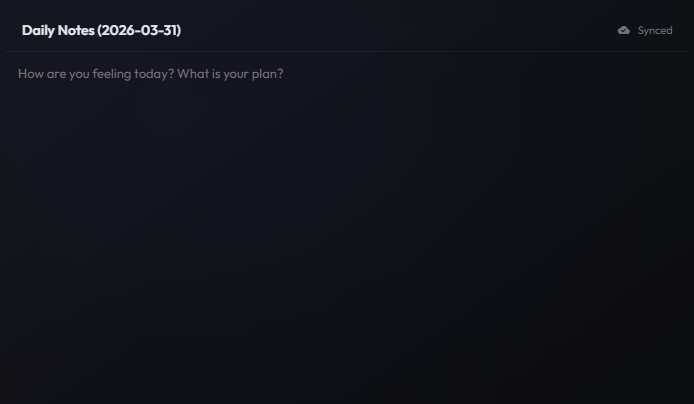
Review & Reflect
Rich-text daily notes. Document lessons, emotions, and what to improve tomorrow. Then link your plans to executed trades to close the feedback loop.
Every strategy deserves its own playbook.
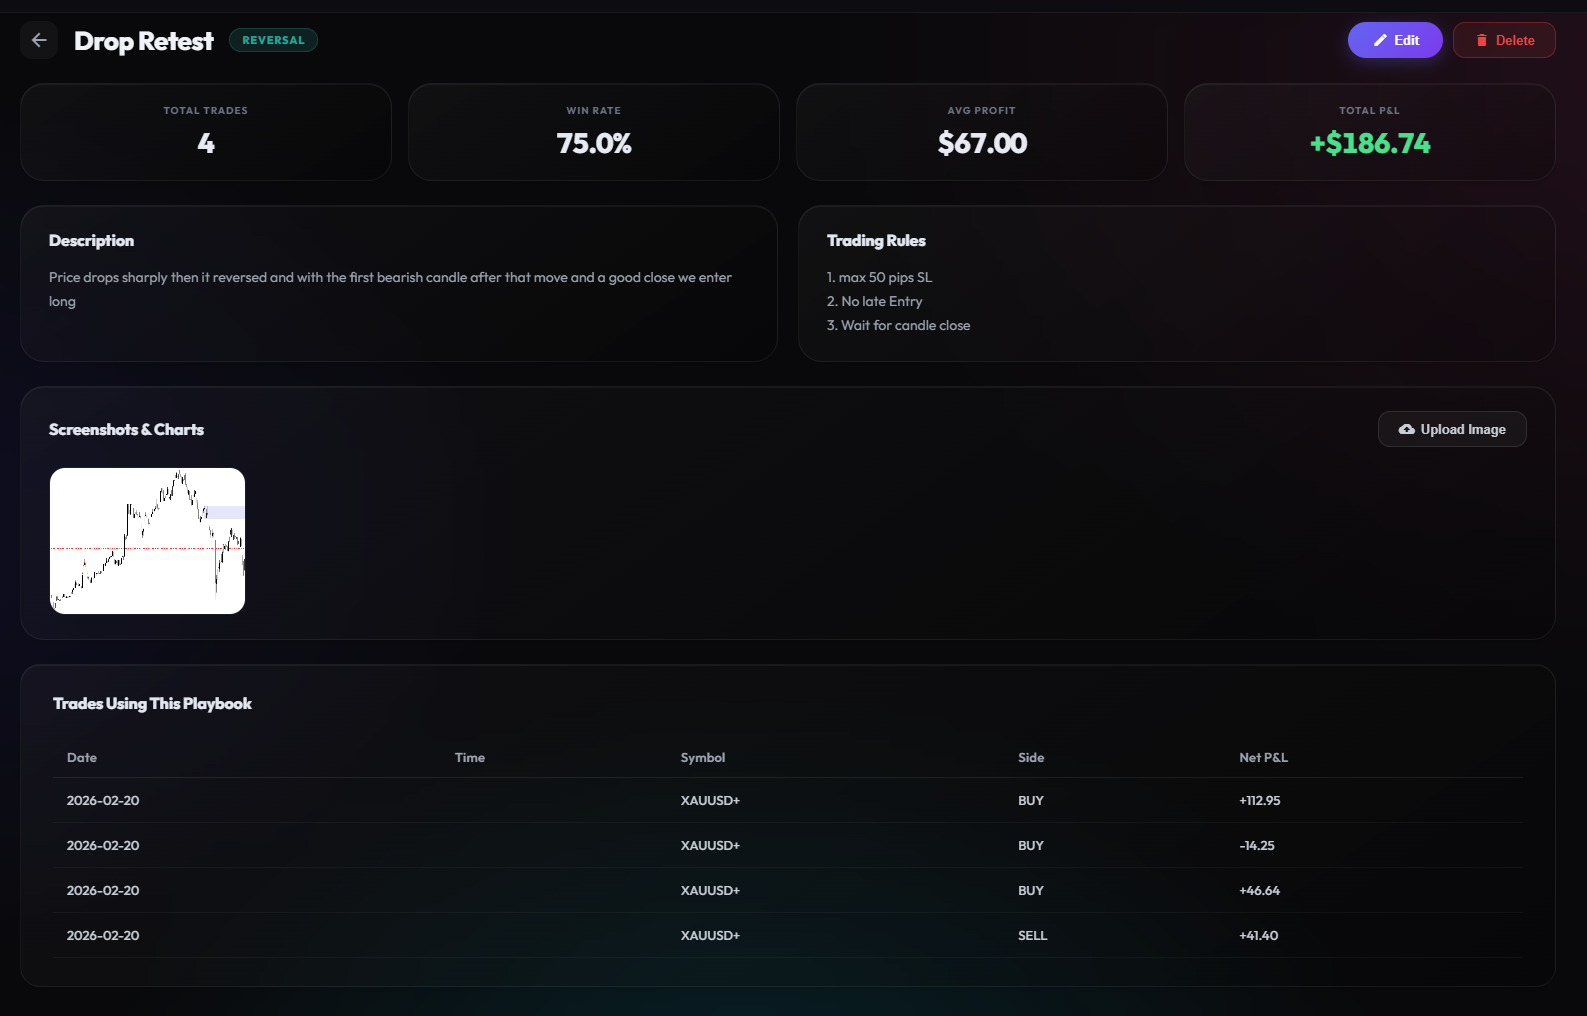
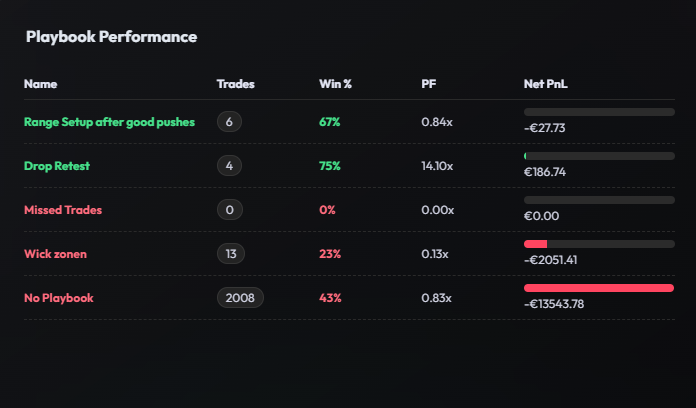
Document. Track. Improve.
Create a playbook for every strategy — entry criteria, risk rules, psychology notes. Assign trades to playbooks so Alro tracks live performance. You'll always know what actually works.
- Complete strategy documentation
- Pre-entry checklist per playbook
- Good/bad example trades with images
- Live stats: Win Rate, Profit Factor, Net P&L
Traded. Now zoom in on every single execution.
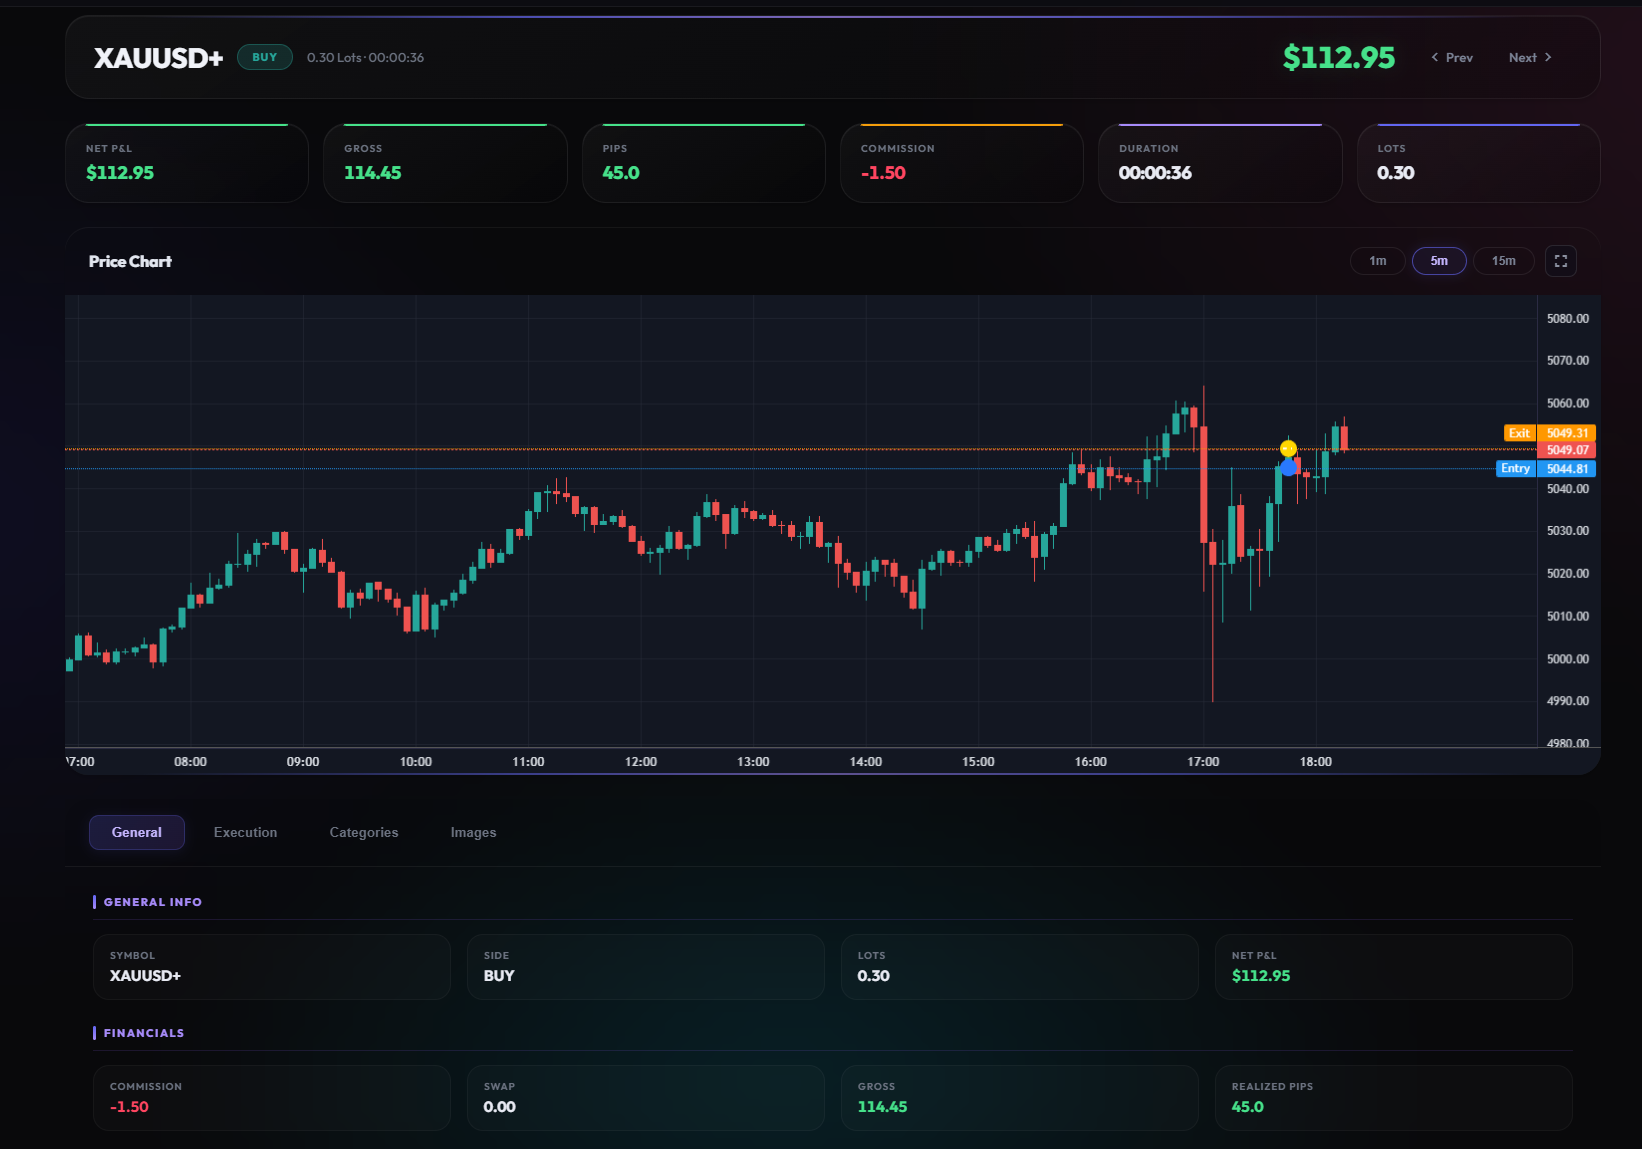
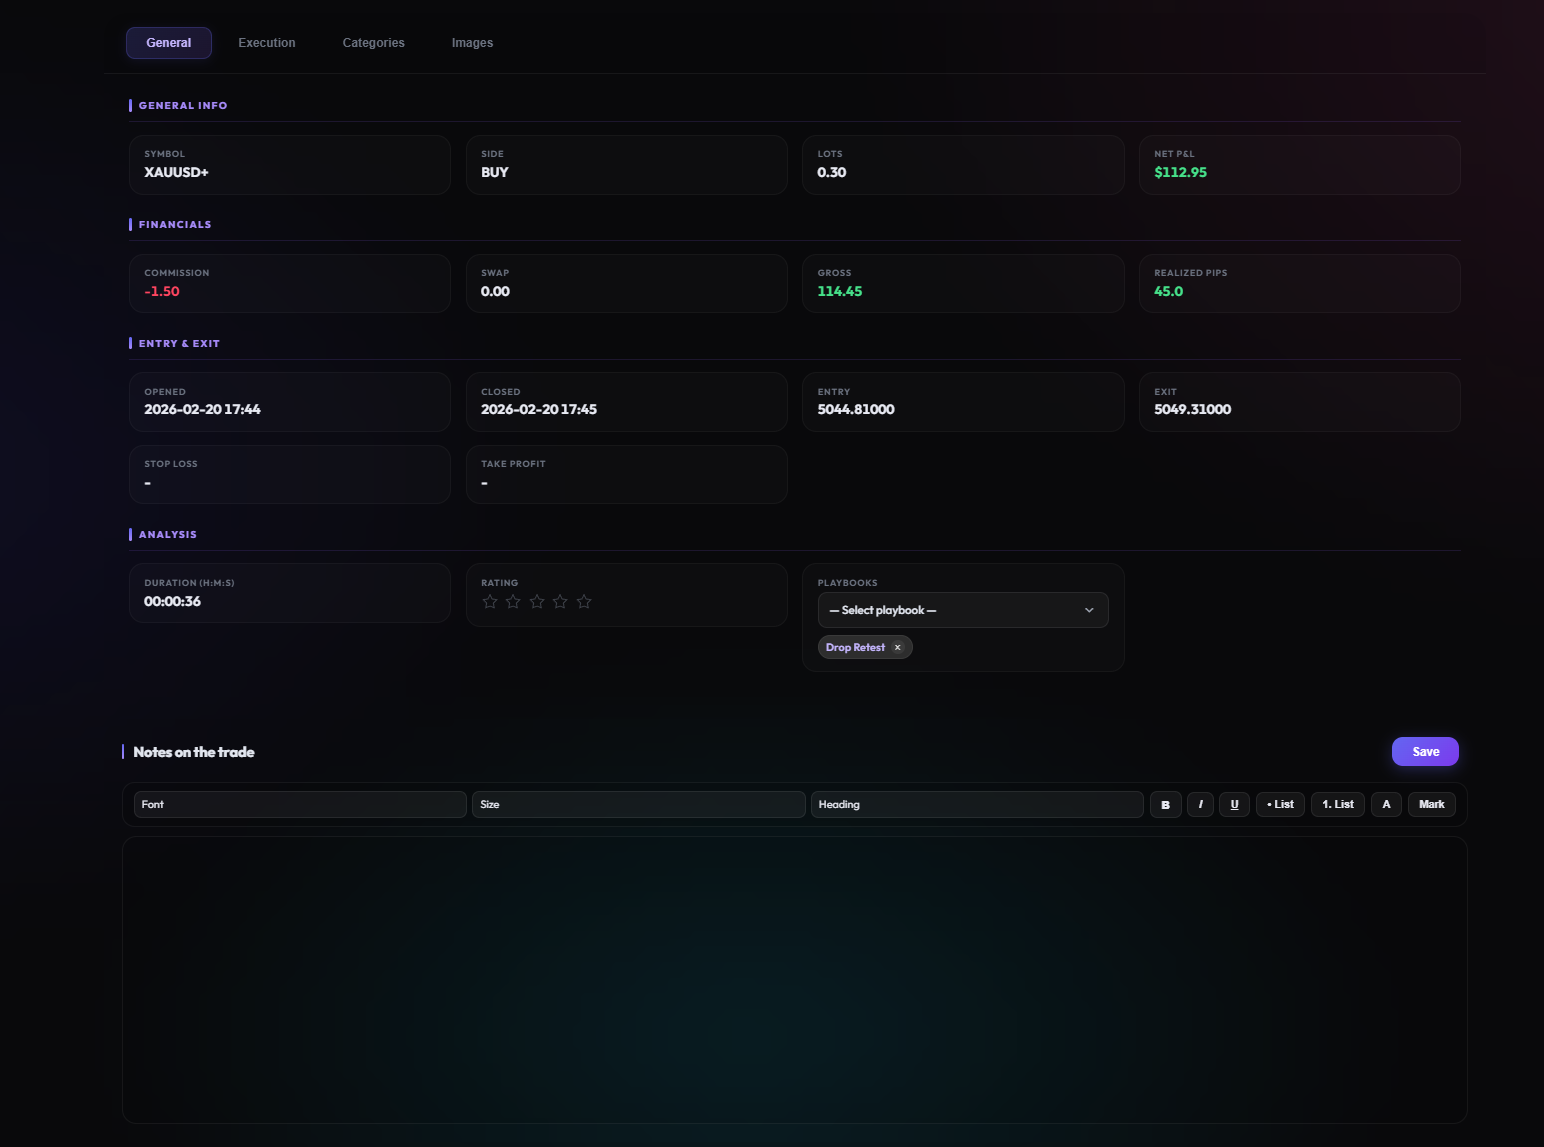
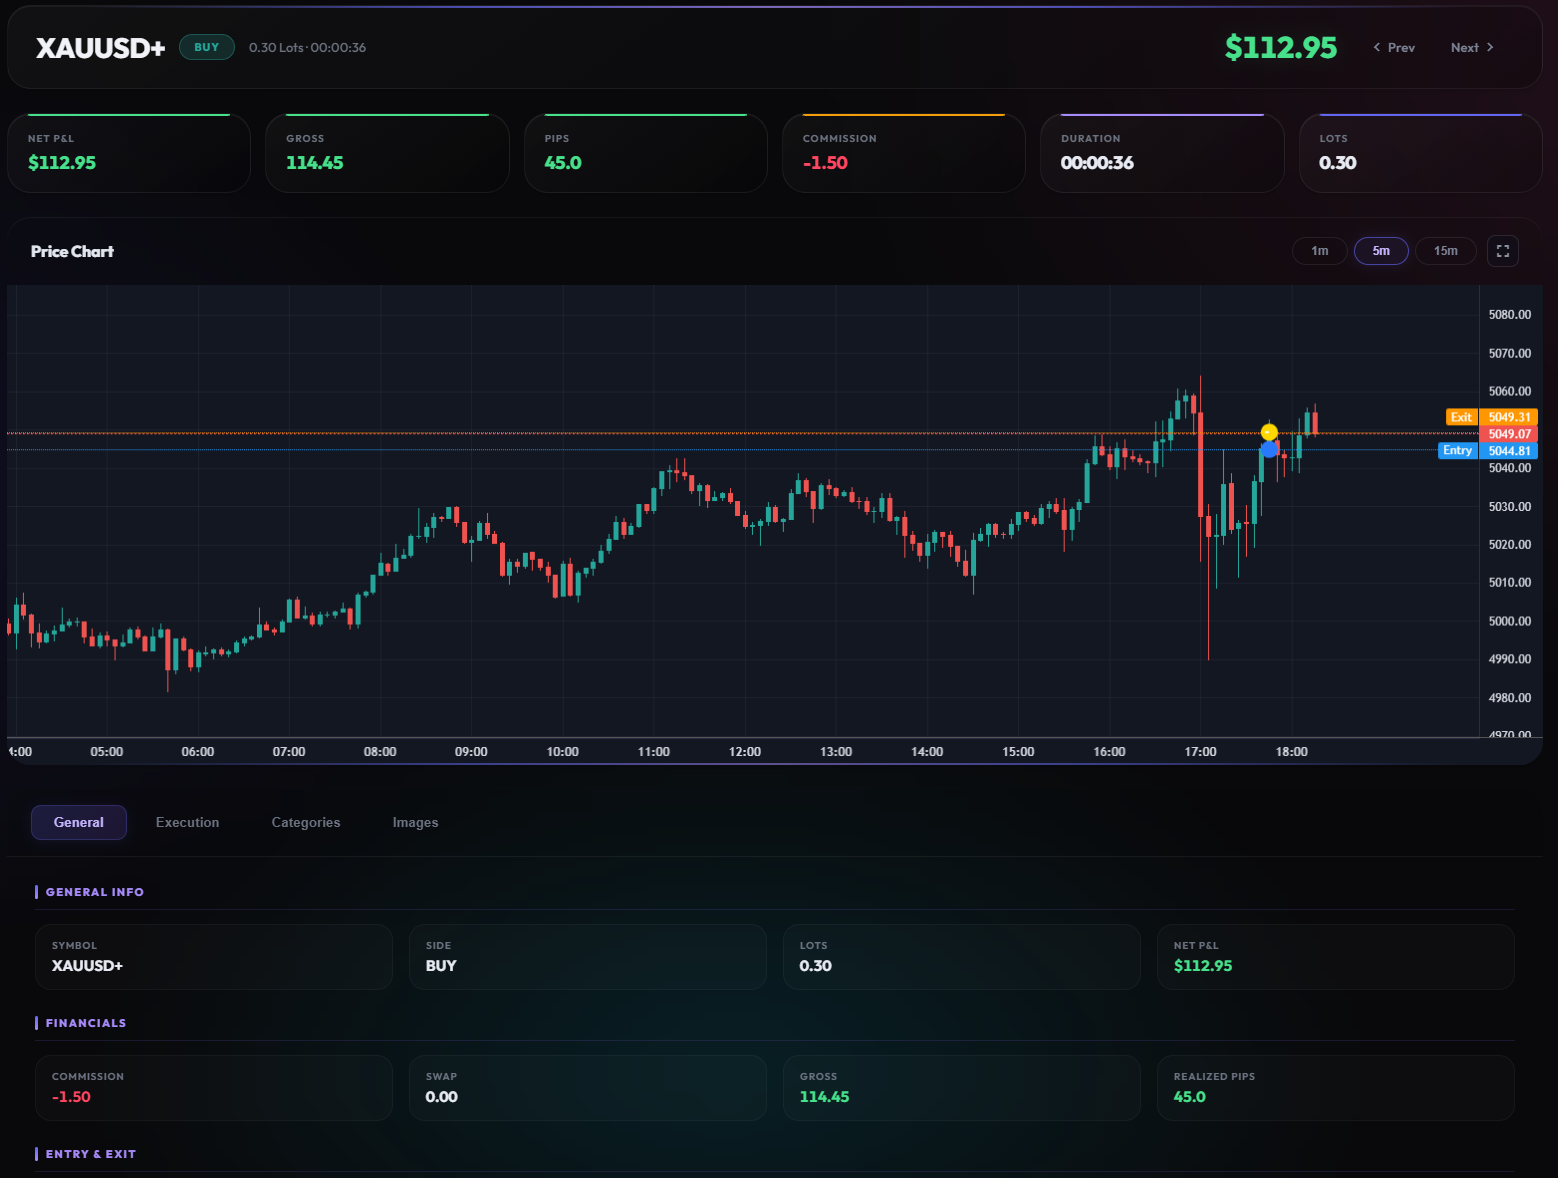
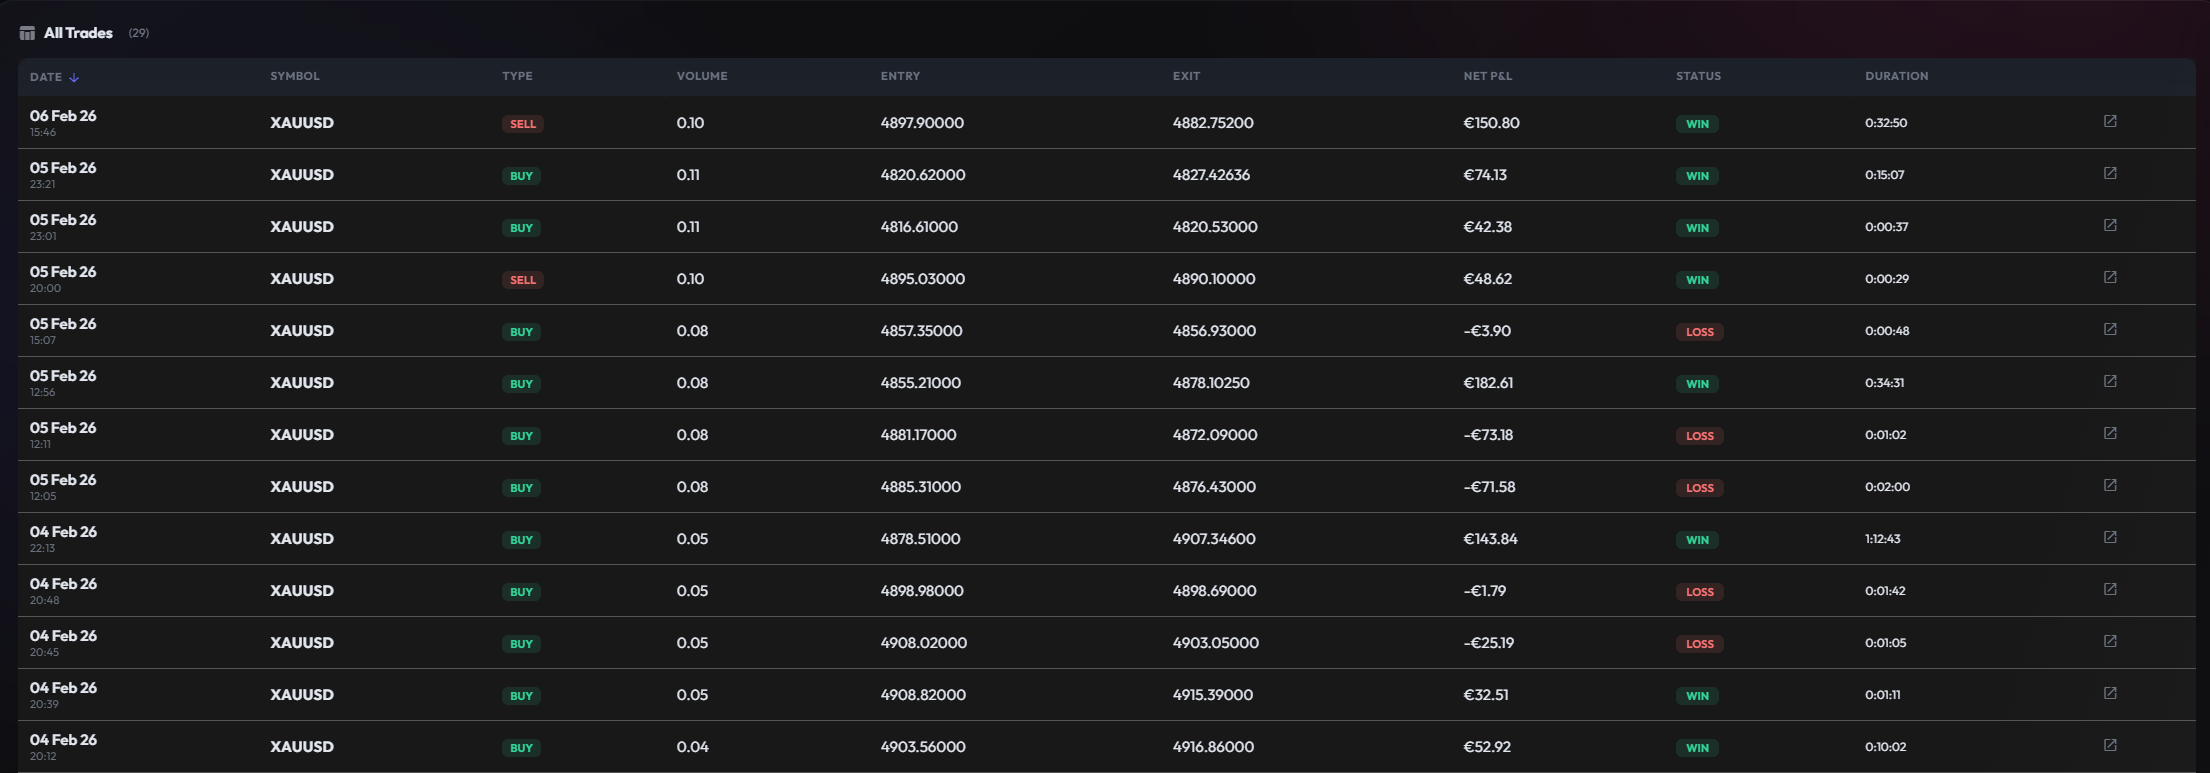
Every Trade. Every Detail.
Click any trade in your dashboard to open a full detail view. See the OHLC chart with all your executions plotted. Rate it, categorize it, add notes and images, assign a playbook — turn raw data into lasting lessons.
Great traders learn with others. Never alone.
Grow Together
Invite a mentor or coach to see your dashboard in read-only mode. They can review your trades, leave notes, and guide your development — all inside the platform. You can be mentor and mentee at the same time.
- Invite mentor by email
- Full dashboard & trade sharing (read-only)
- Trade-level notes (shared or private)
- Be mentor and mentee simultaneously

Trading is a business. Treat it like one.
Track Your Business
Keep track of expenses, payouts, and your net balance — all alongside your trading data. See the full financial picture in one place.
- Log expenses & payouts with receipts
- Category breakdowns & trend charts
- Net business balance at a glance
Numbers tell a story. Reports let you read it.
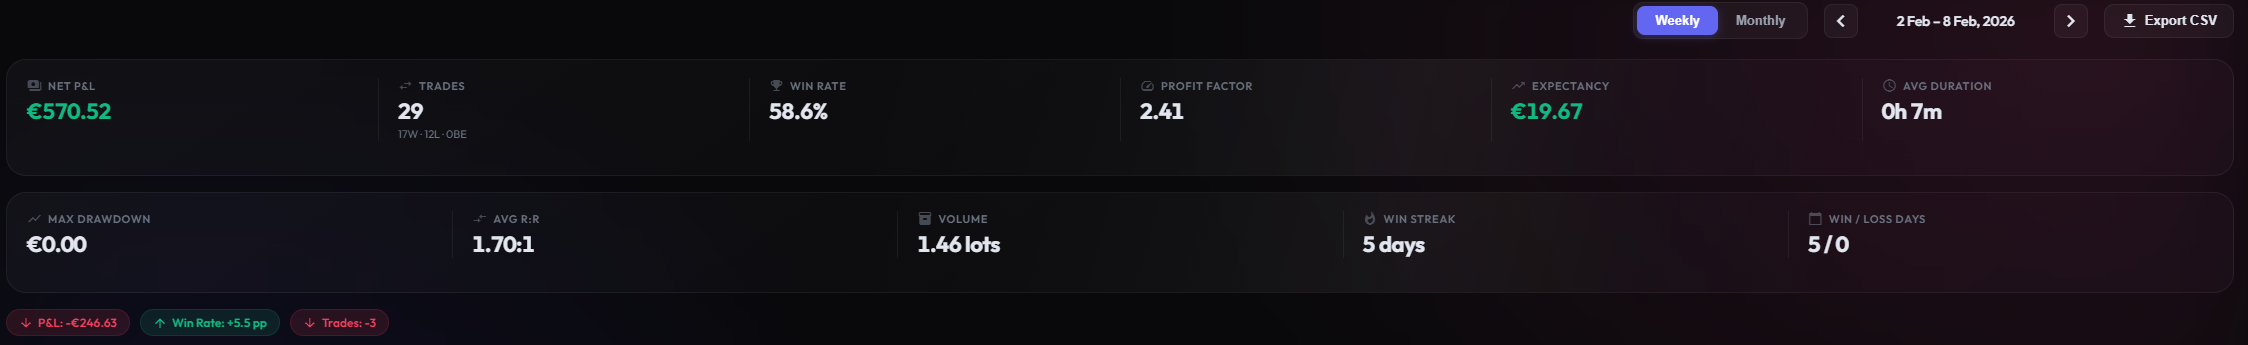
See the Bigger Picture
Generate advanced performance reports across any time range. Compare accounts, drill into symbol-level breakdowns, and export everything to CSV for deeper analysis.
Data without discipline is just noise. Let's add the guardrails.
Protect Your Capital. Automatically.
Set custom rules for daily loss limits, position sizing, consecutive losses, and more. Get email alerts the moment a rule is breached. Track your discipline with a risk calendar, analytics, and an A-to-F risk grade.
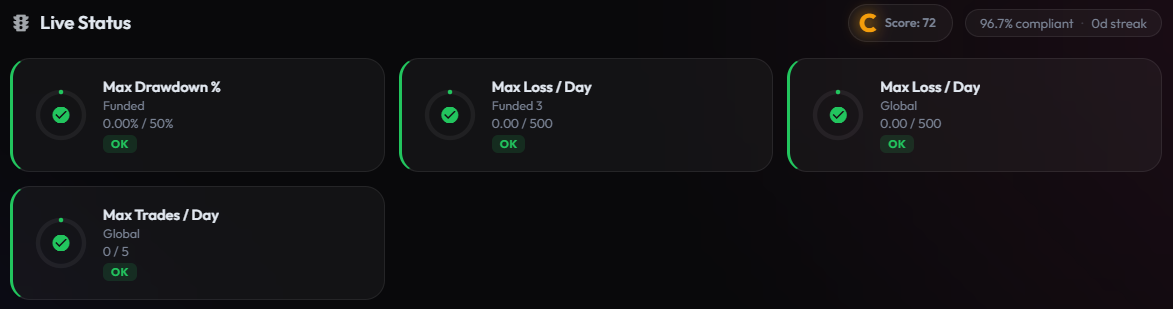
Live Status & Email Alerts
Real-time traffic-light indicators show how close you are to each rule. When a breach happens, you get an instant email — on every plan.
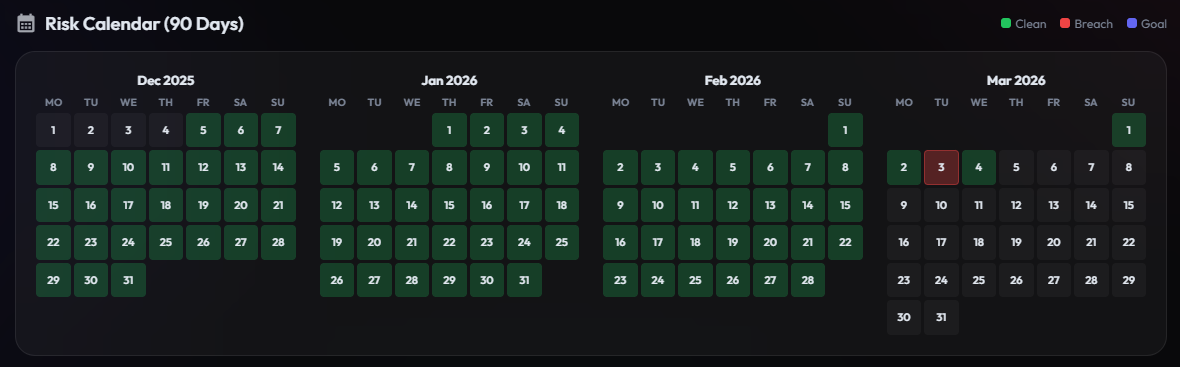
Risk Calendar & Grade
Every day is rated green (no breaches), yellow (goals hit), or red. Your overall risk grade (A–F) updates automatically. Spot patterns before they cost you money.
Ready to trade smarter?
7 days free. No credit card required. Cancel anytime.
Start Free Trial