Tutorials
Step-by-step guides to master every feature of Alro Analytics.
Guides
Analytics Center
Features
Subscribe
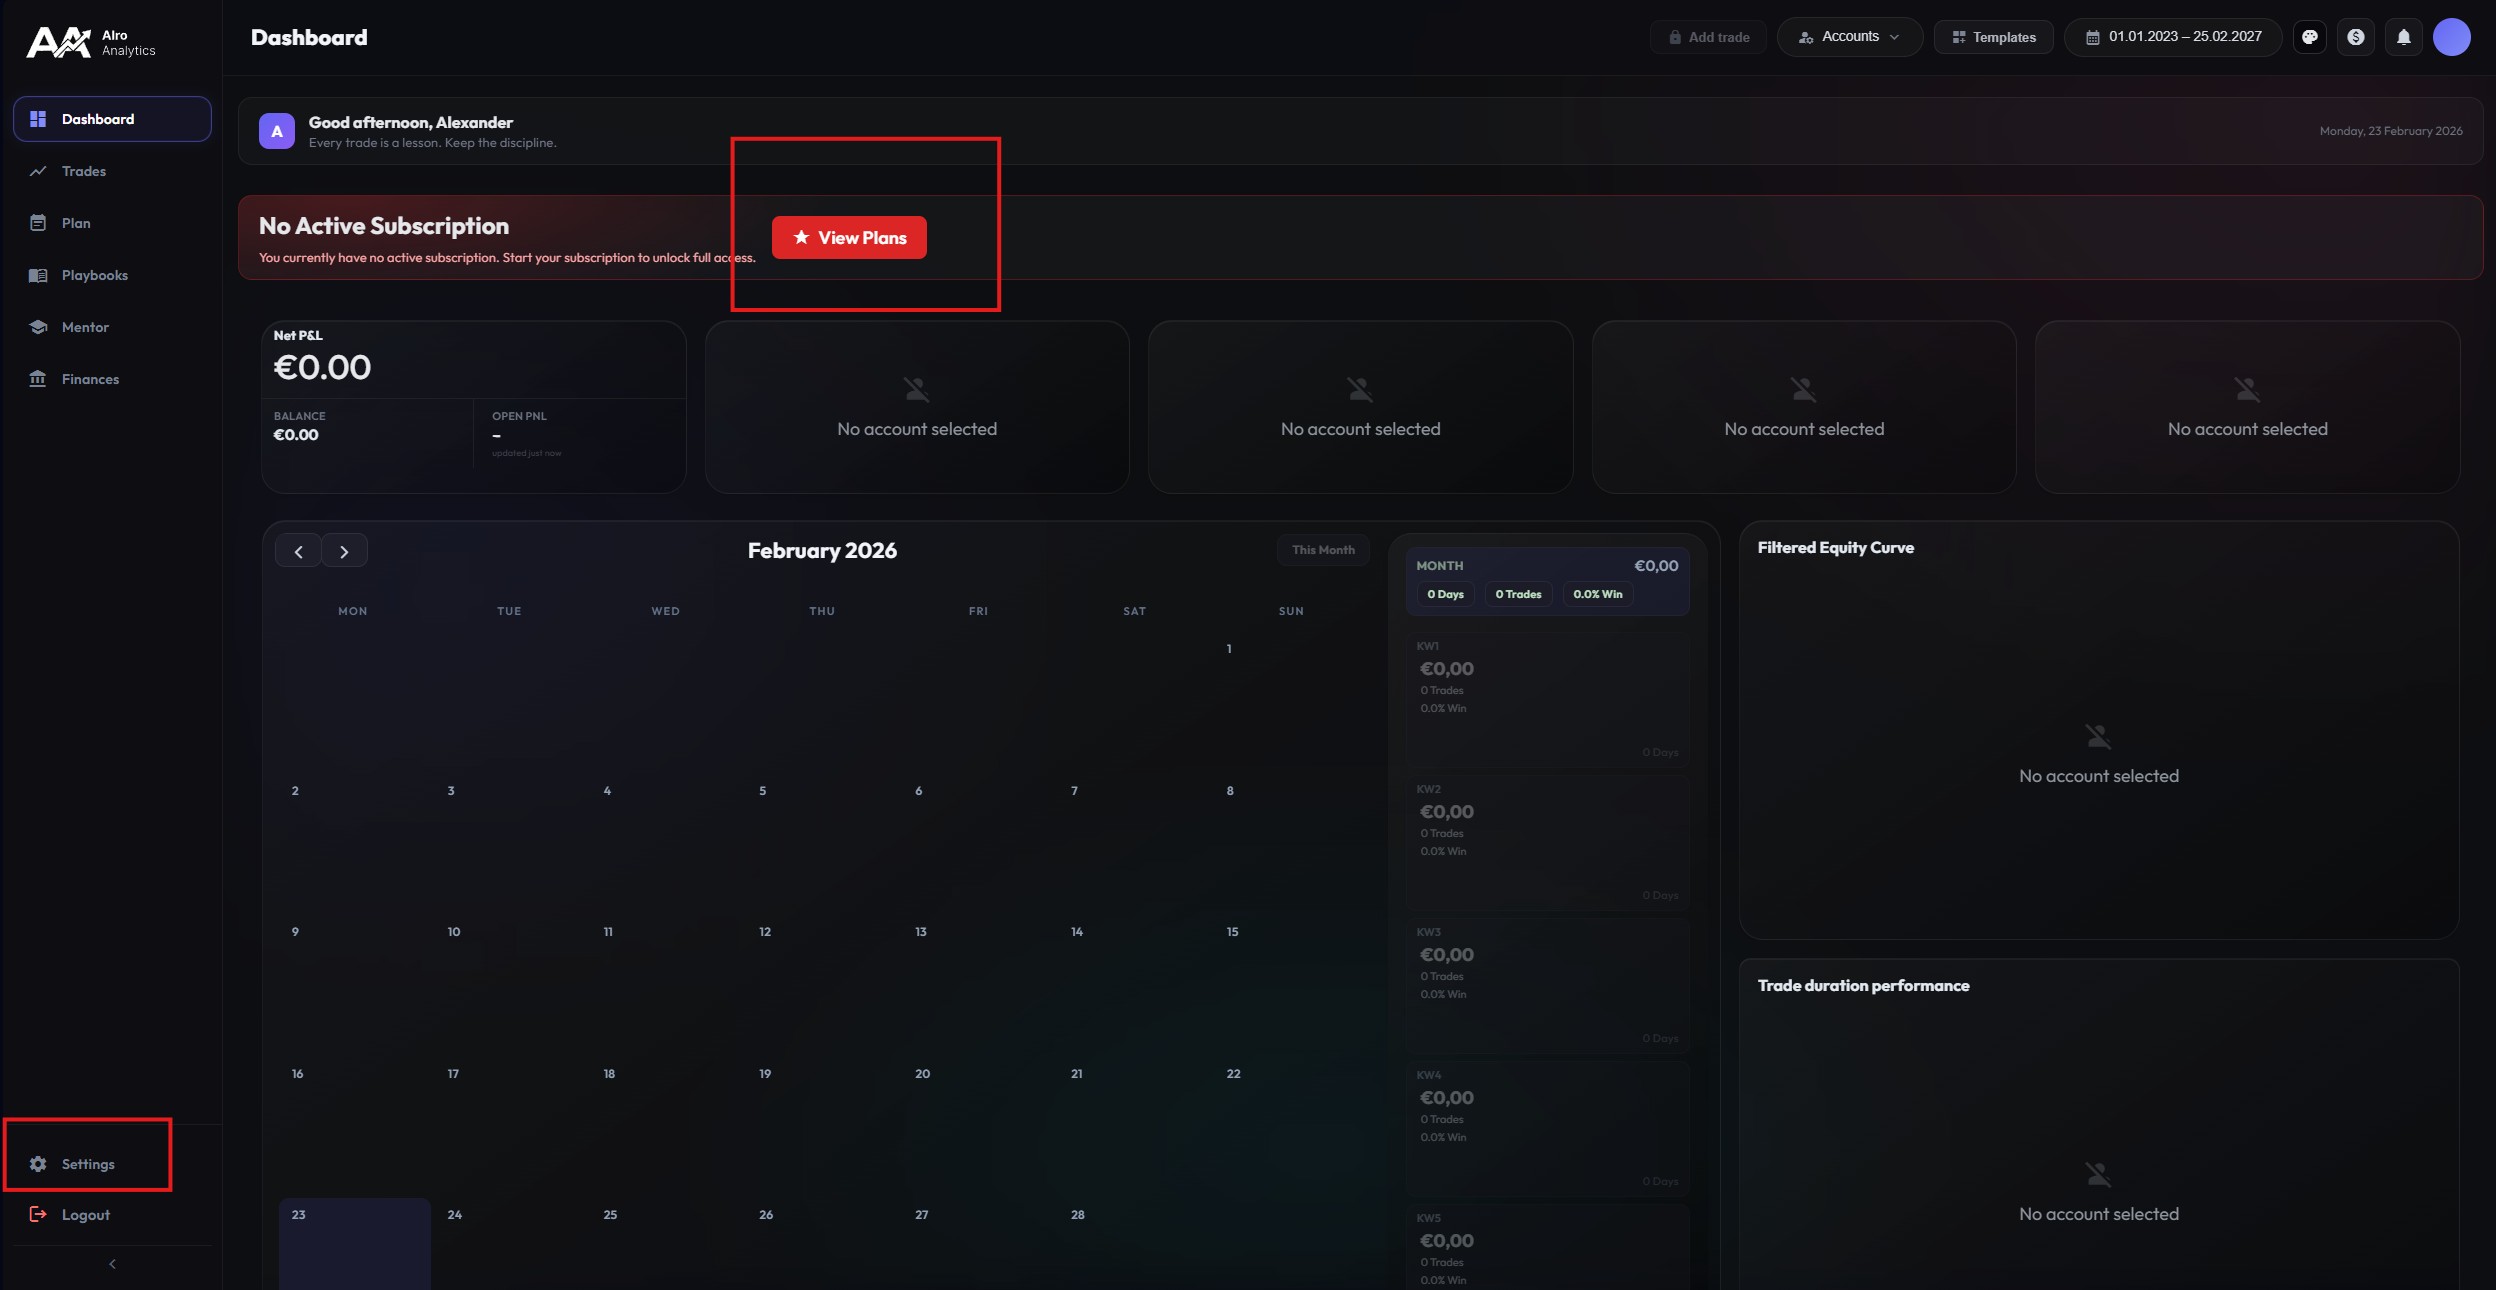
Start your journey to professional data analysis. An active subscription is the key to unlocking all premium features of Alro Analytics.
The process is simple and secure. You have two ways to start the subscription:
- Direct Start: Click on the banner field on your home screen.
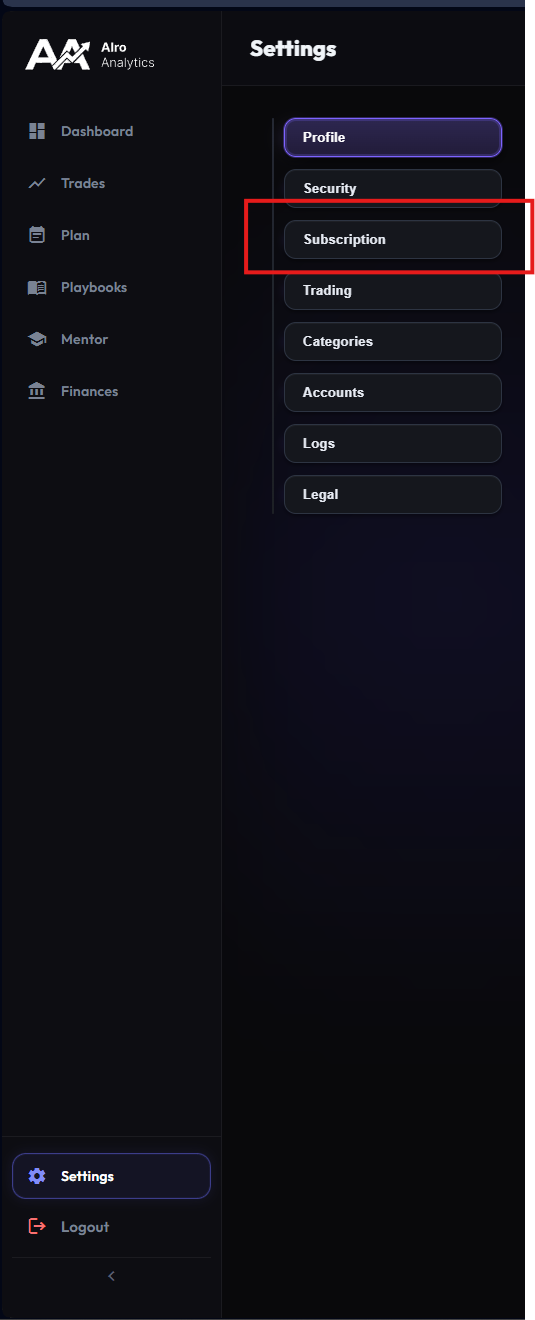
- Via Settings: Navigate to
Settings > Subscription.
All payments are processed securely via our partner Stripe. We do not store credit card details.
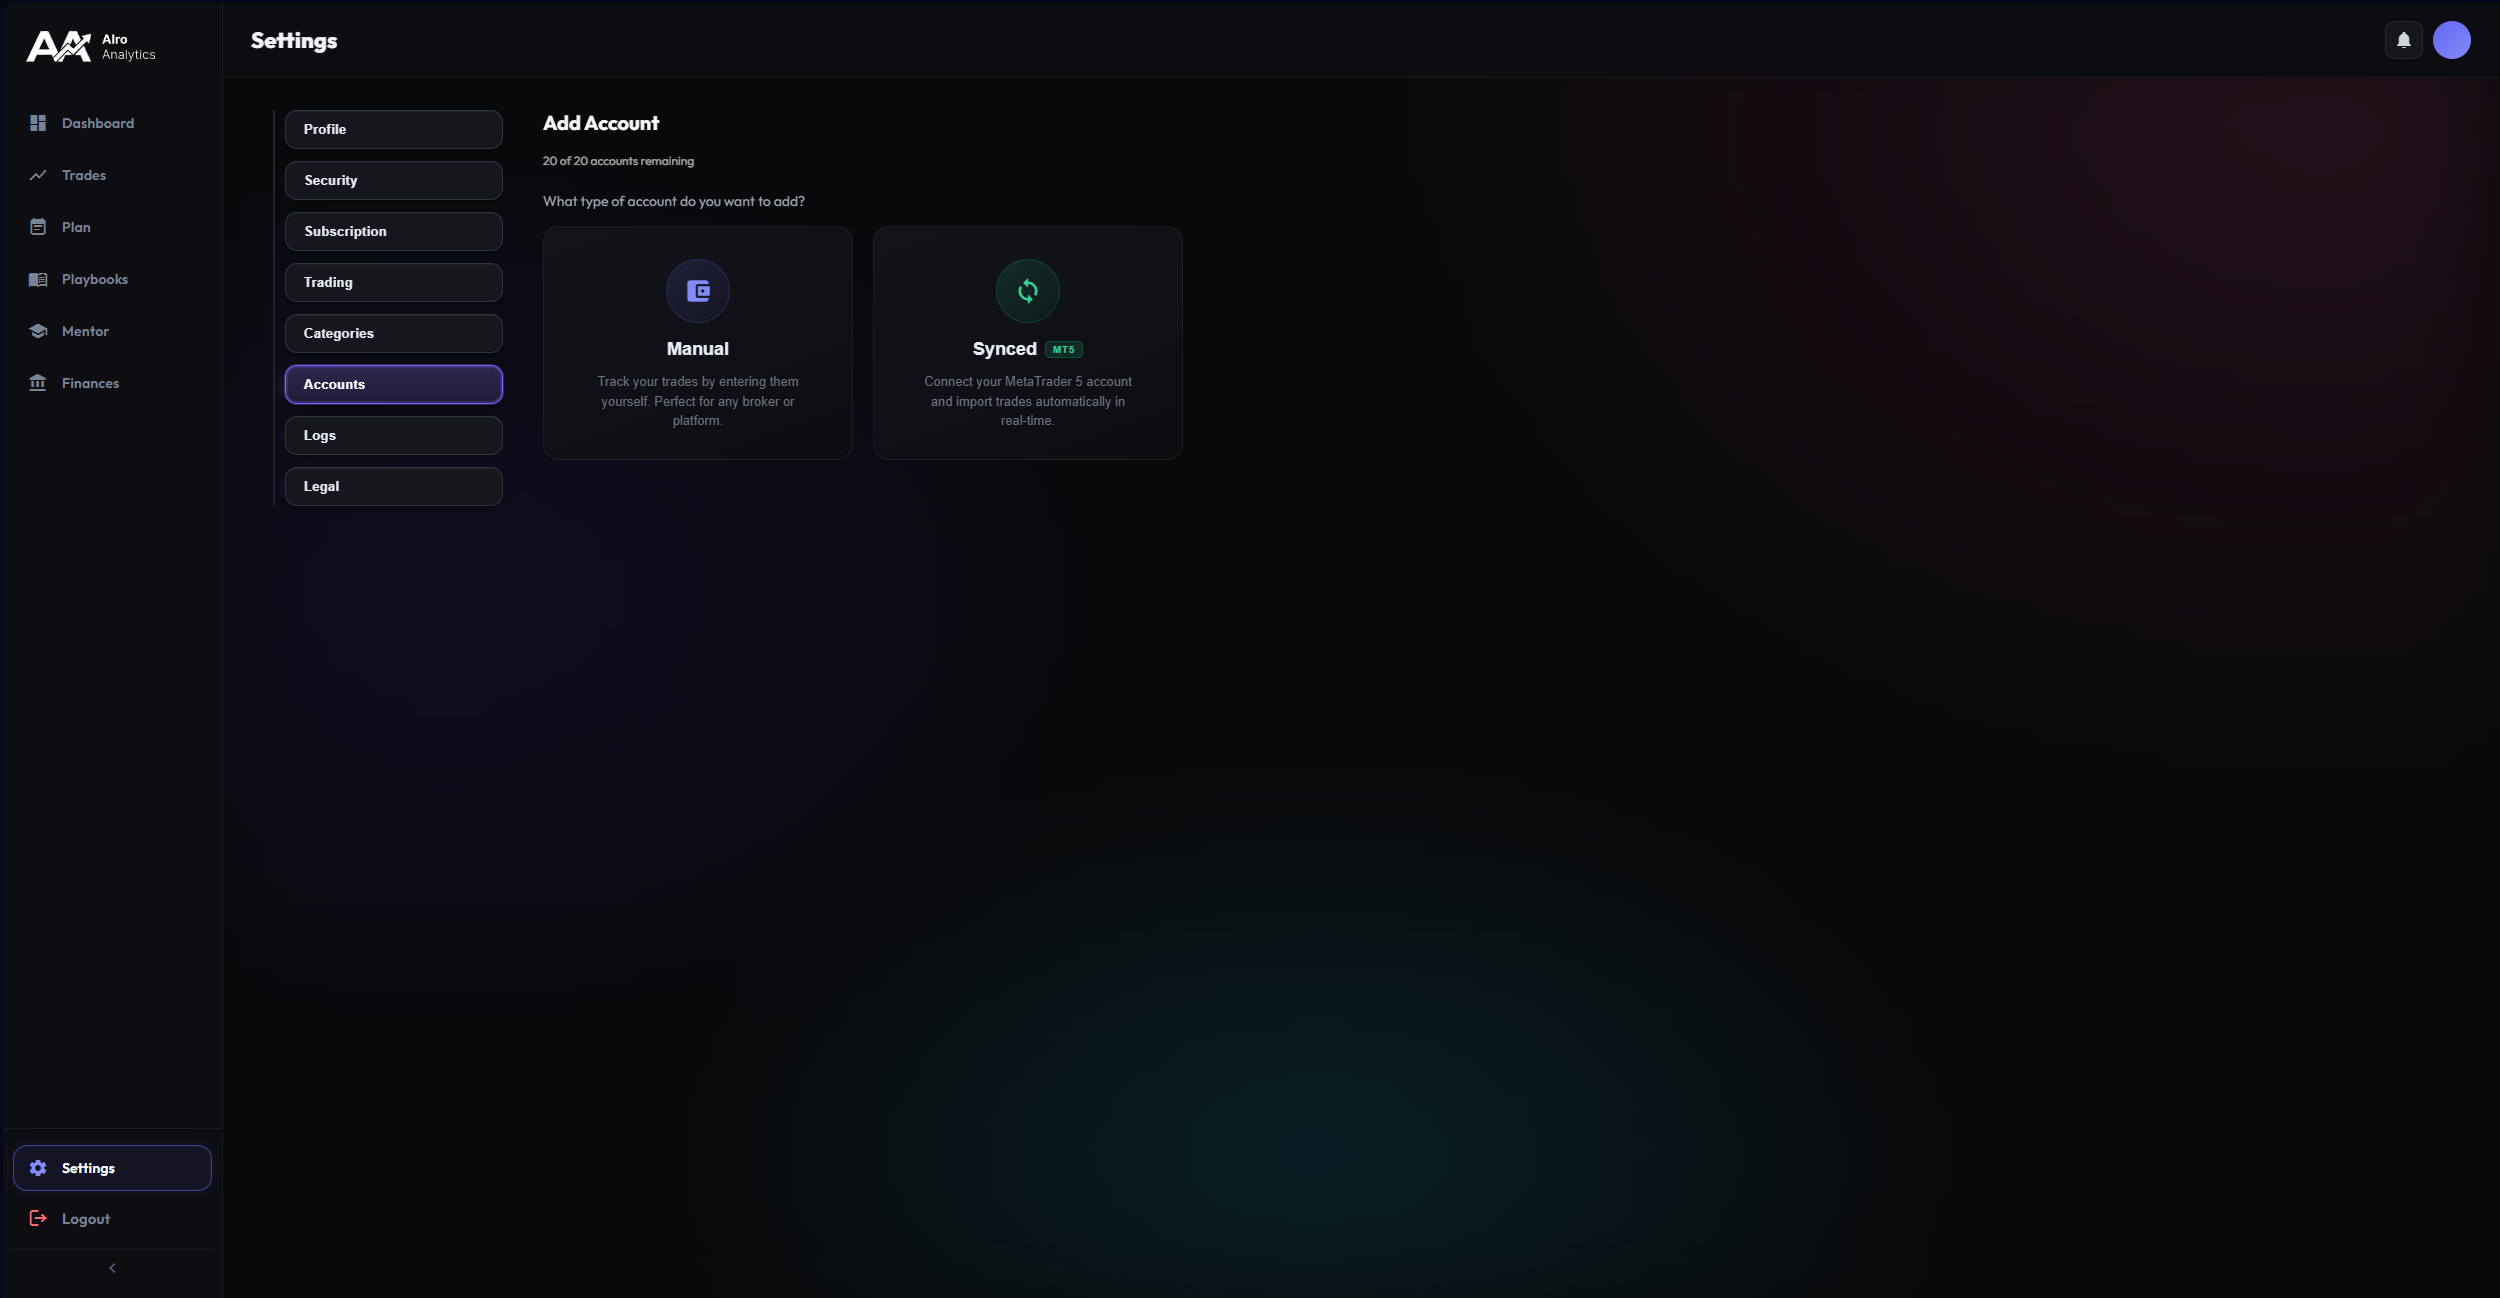
Add Account
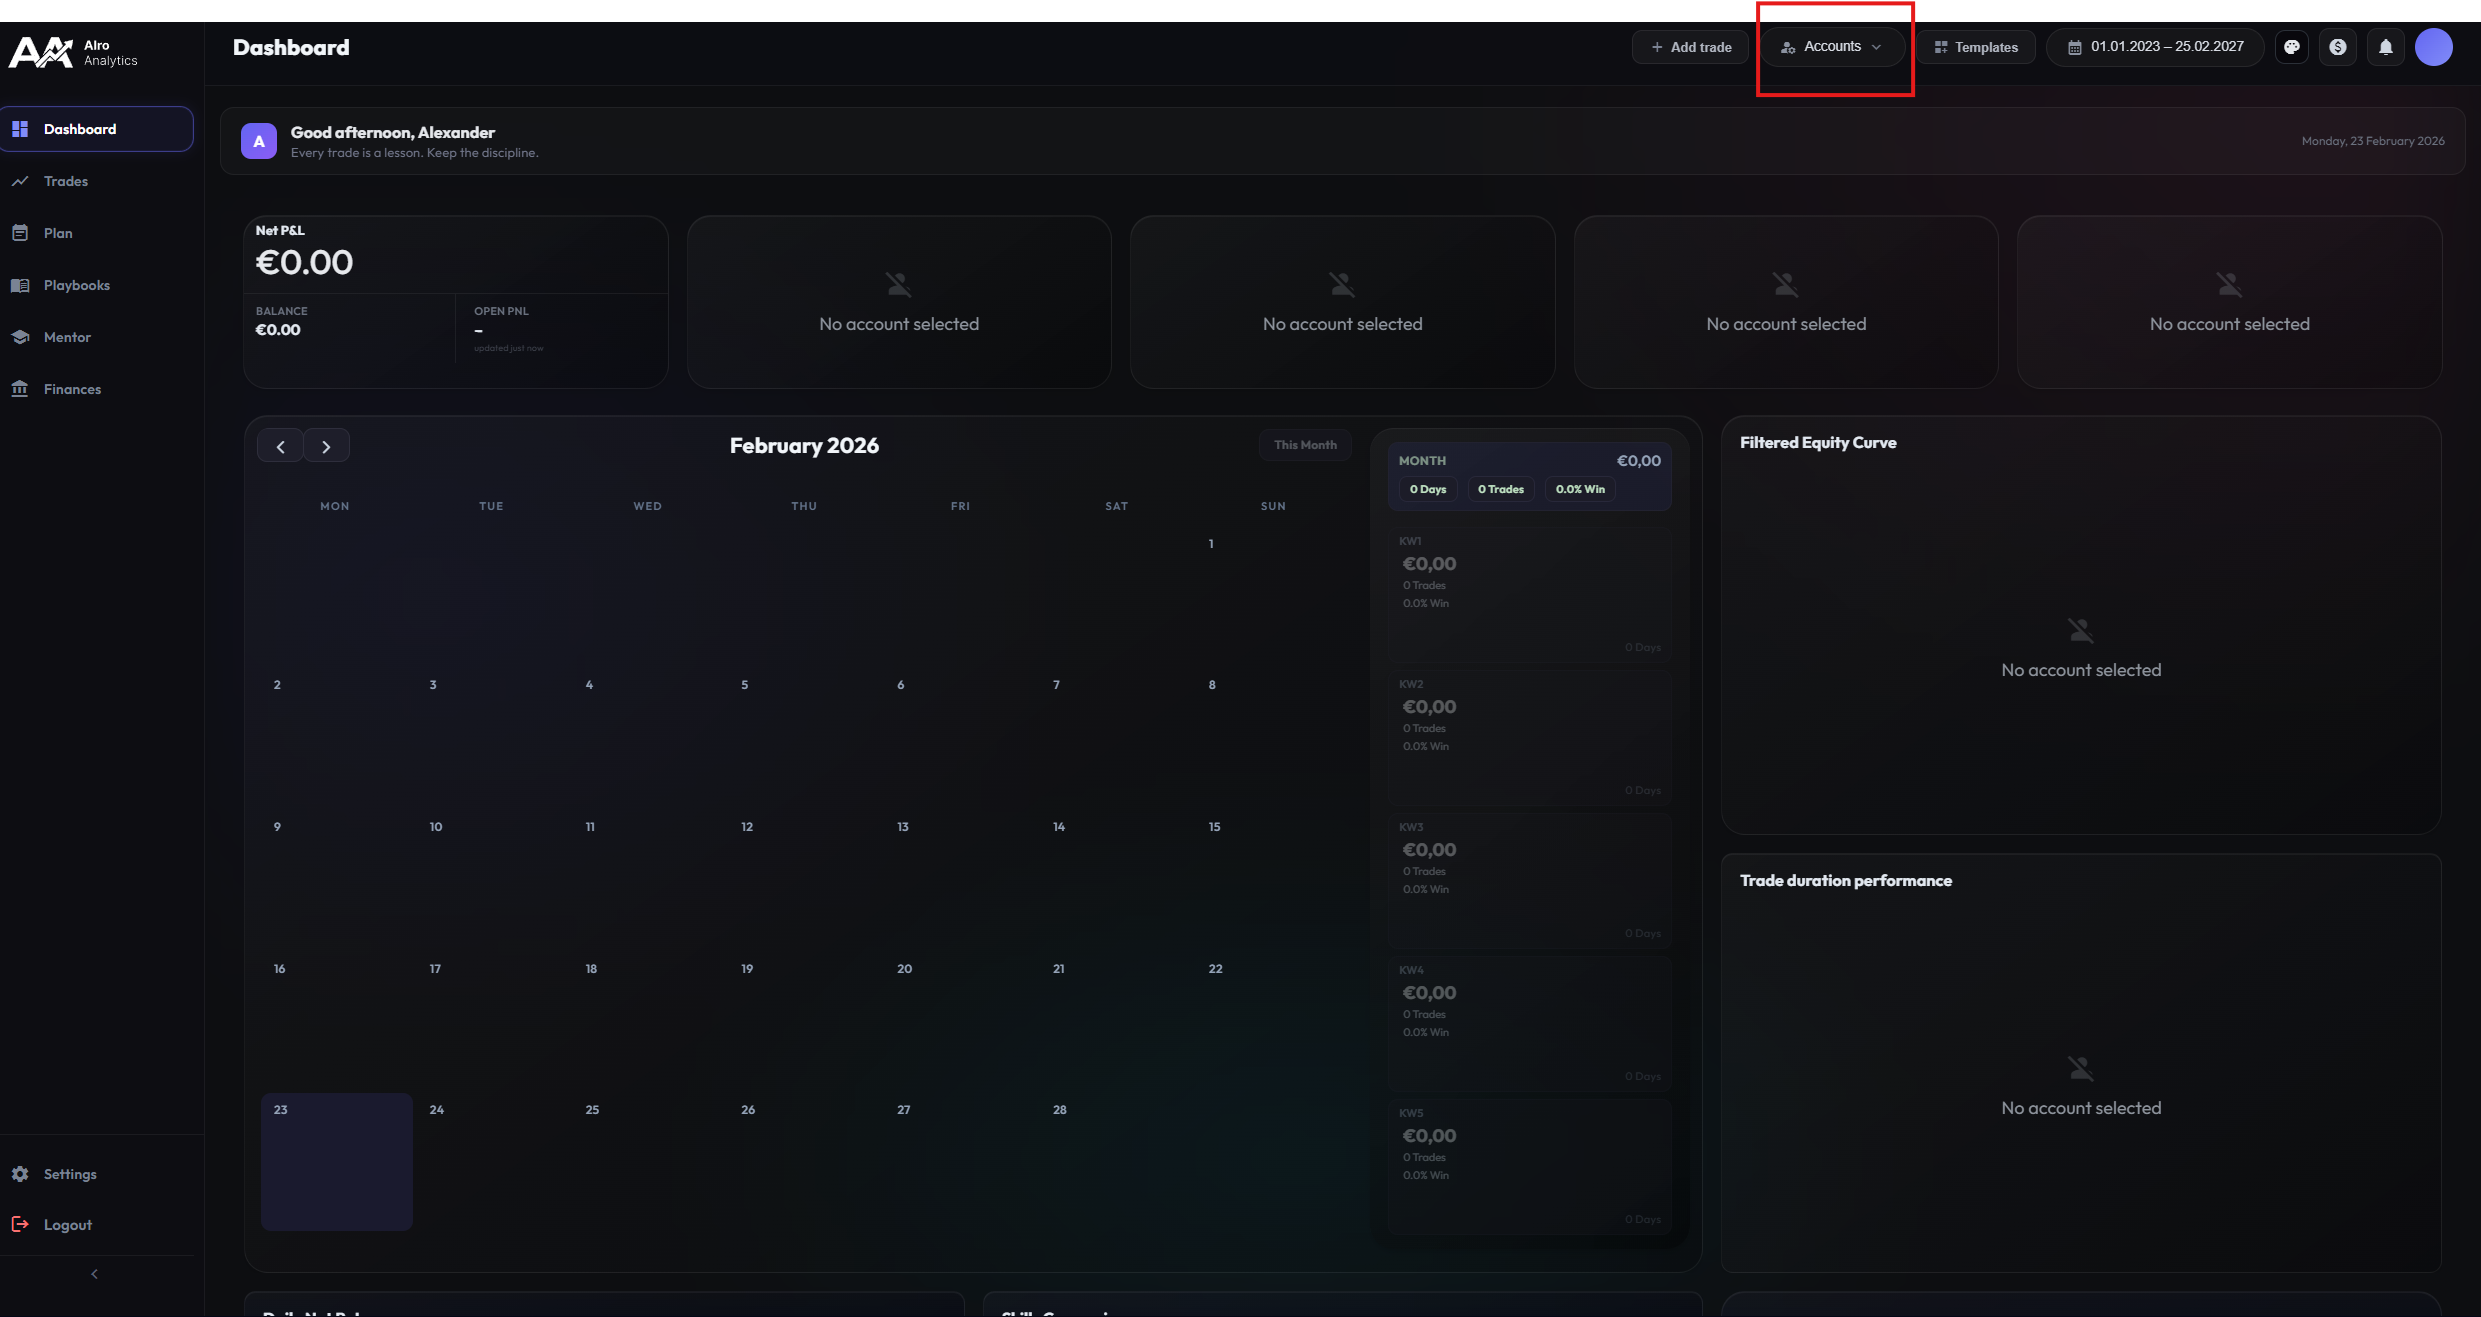
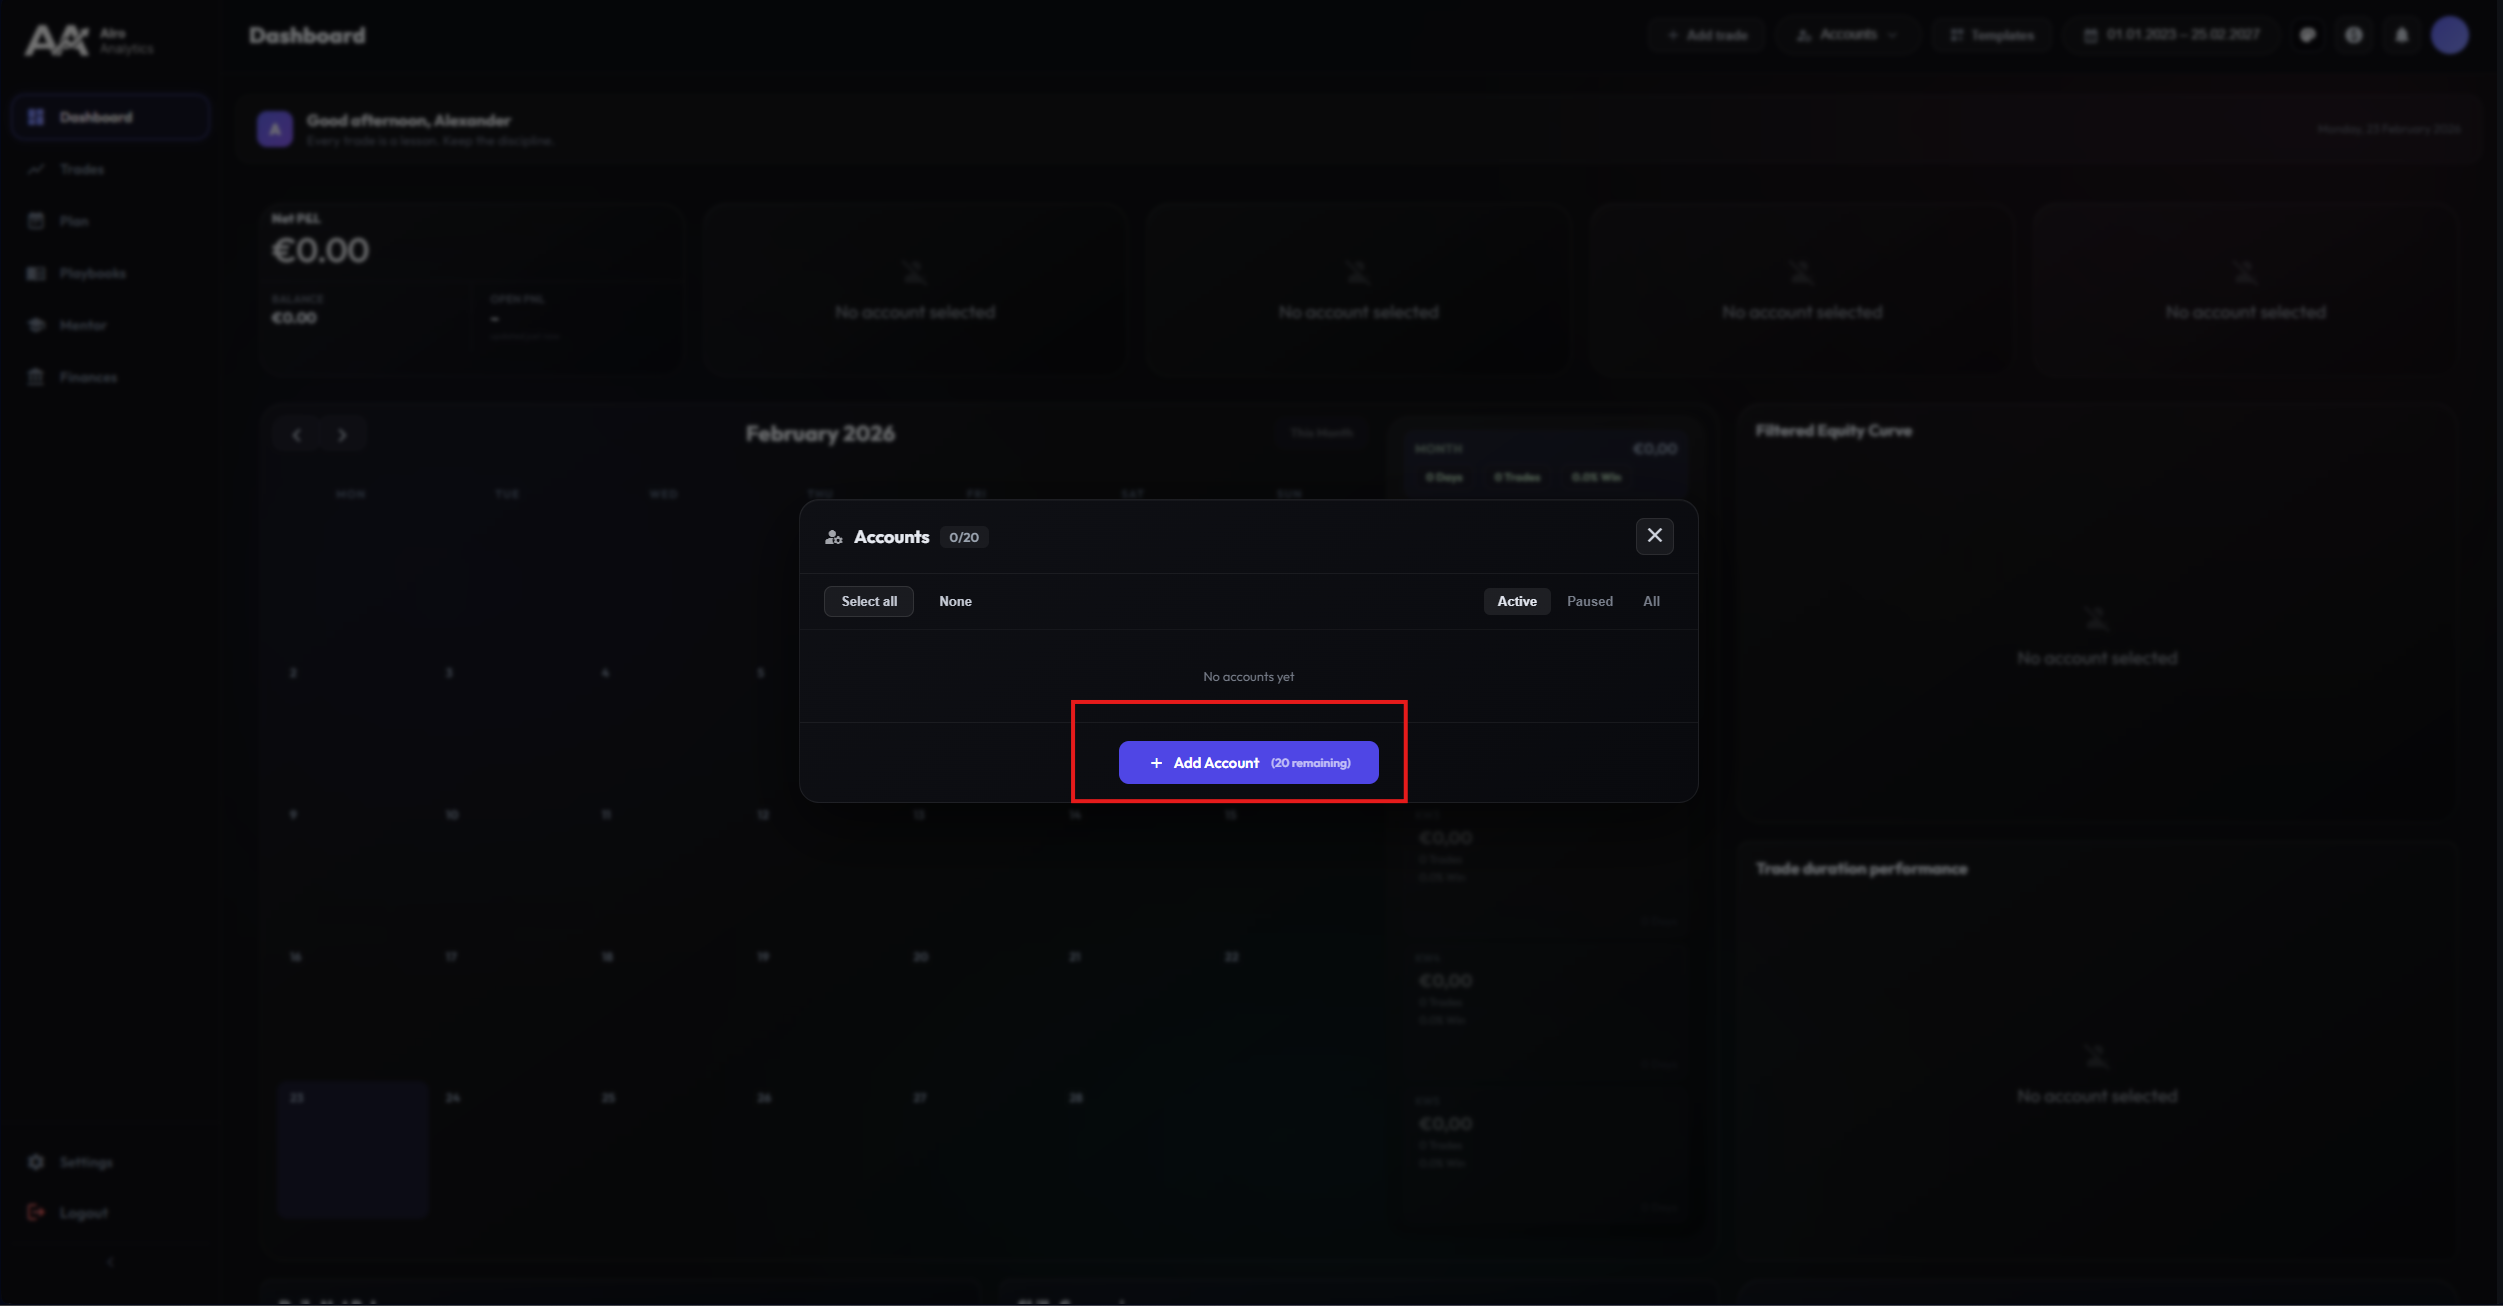
Centralize your trading activities in one place. Alro Analytics supports both fully automatic synchronization with leading brokers and flexible manual entry.
Click the "Add Account" button to start the setup wizard. You will be asked whether you want to connect an existing account or create a manual account.
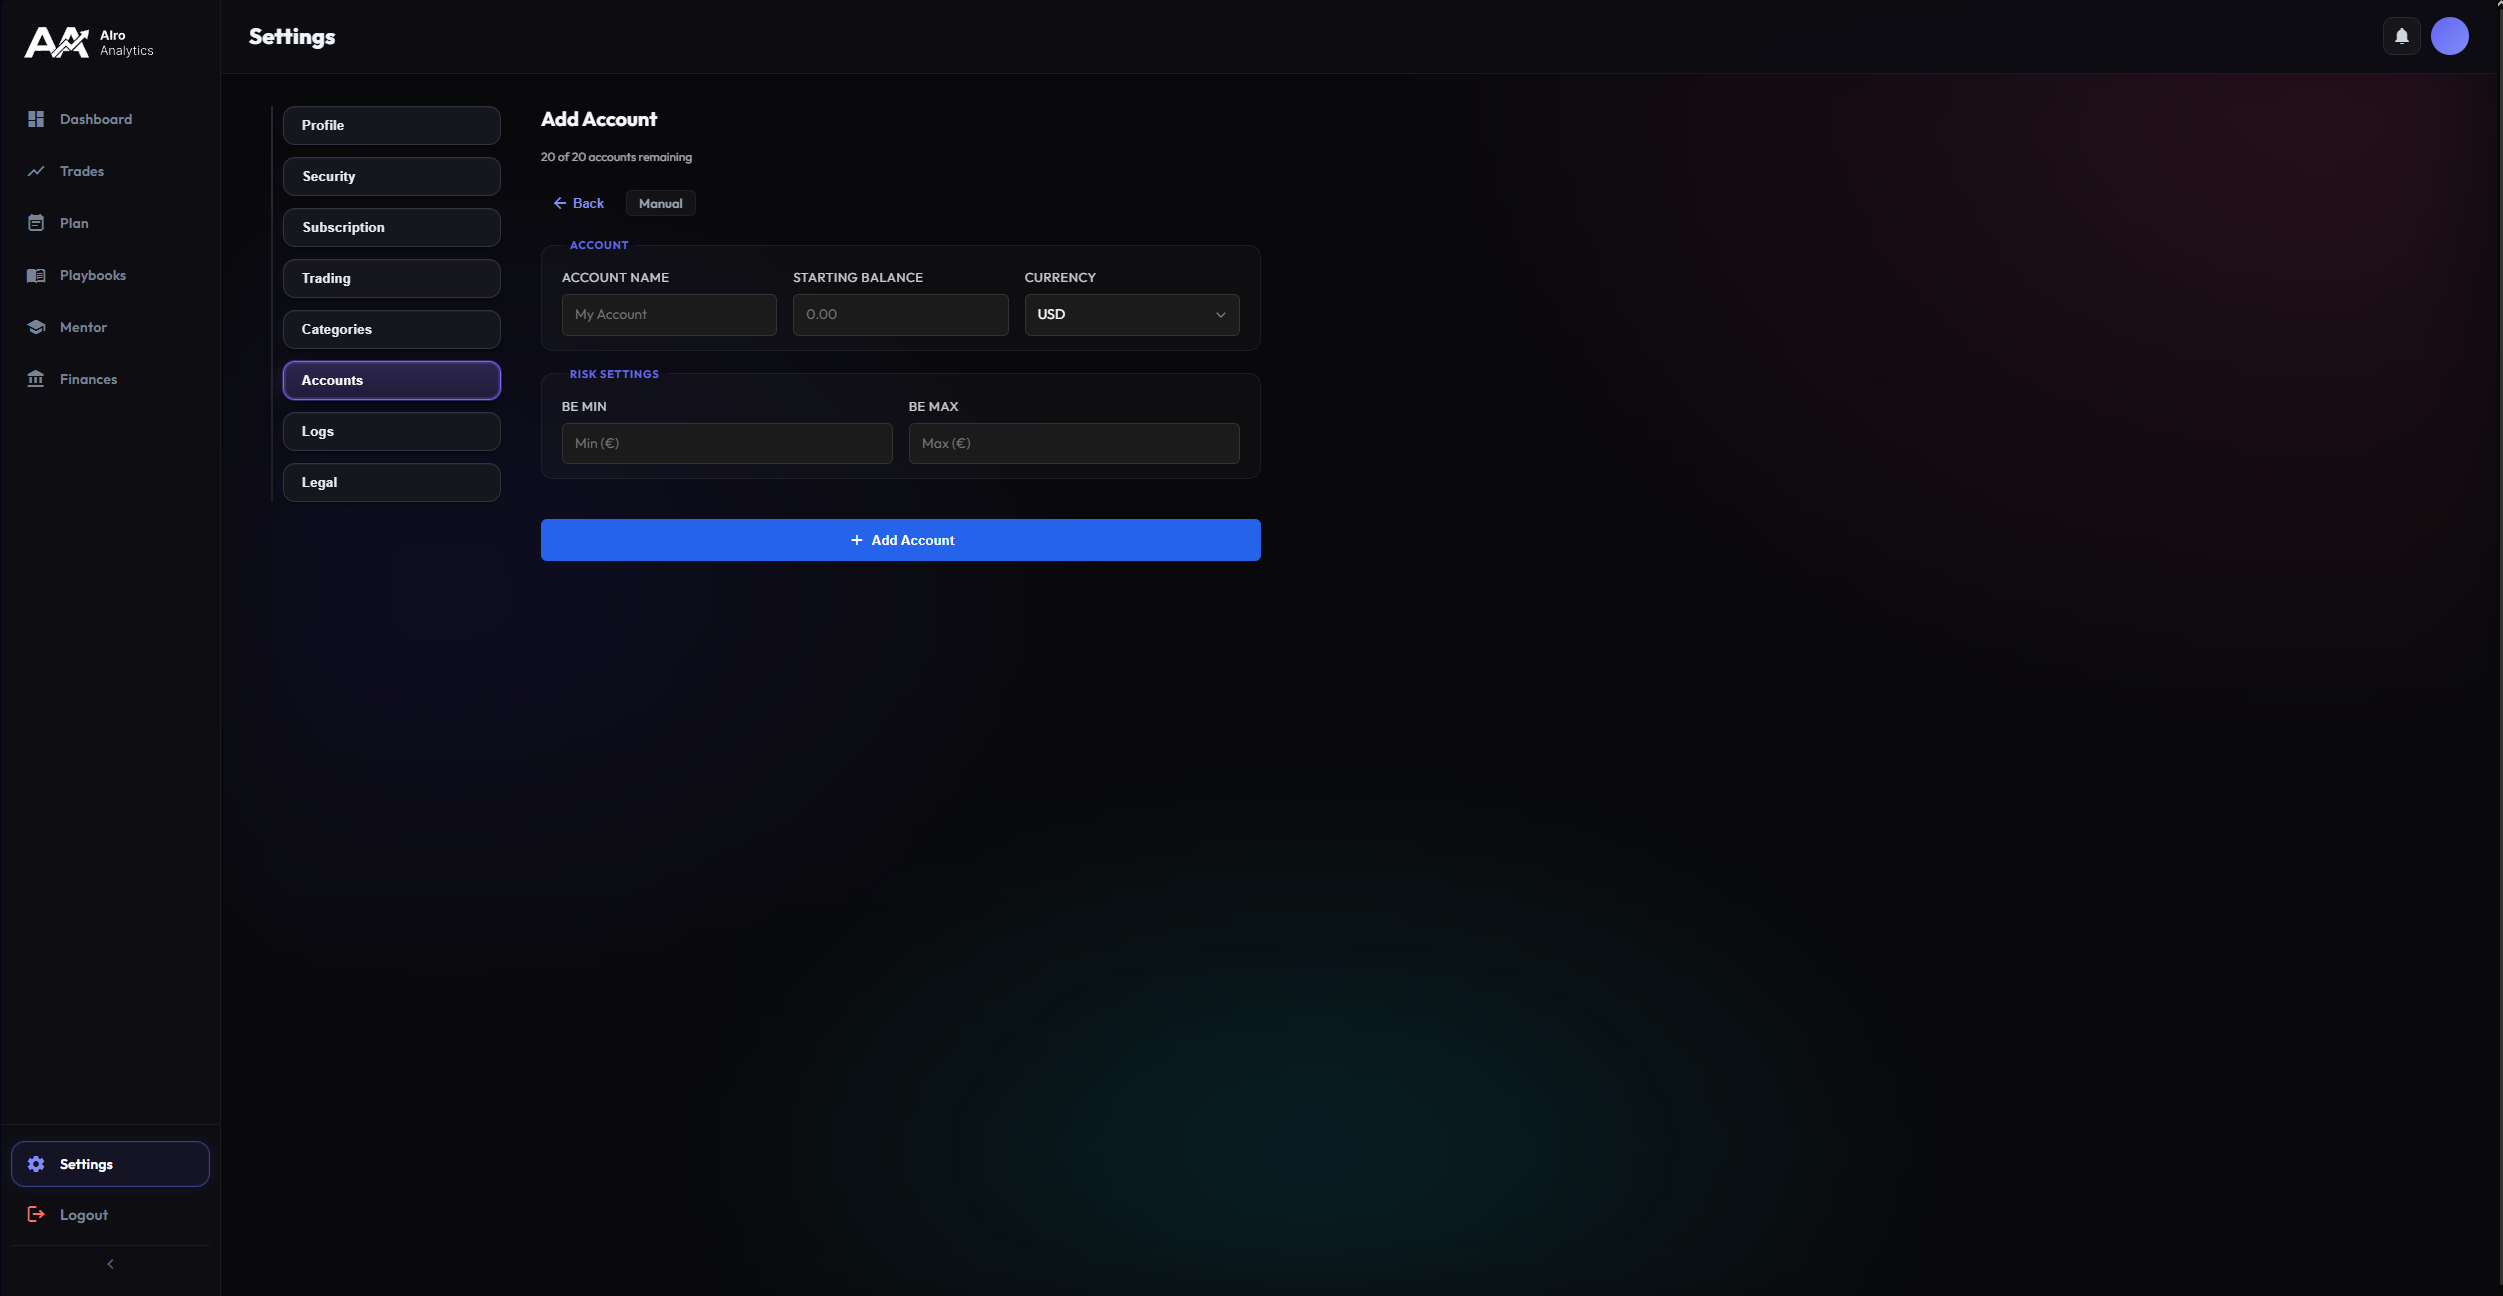
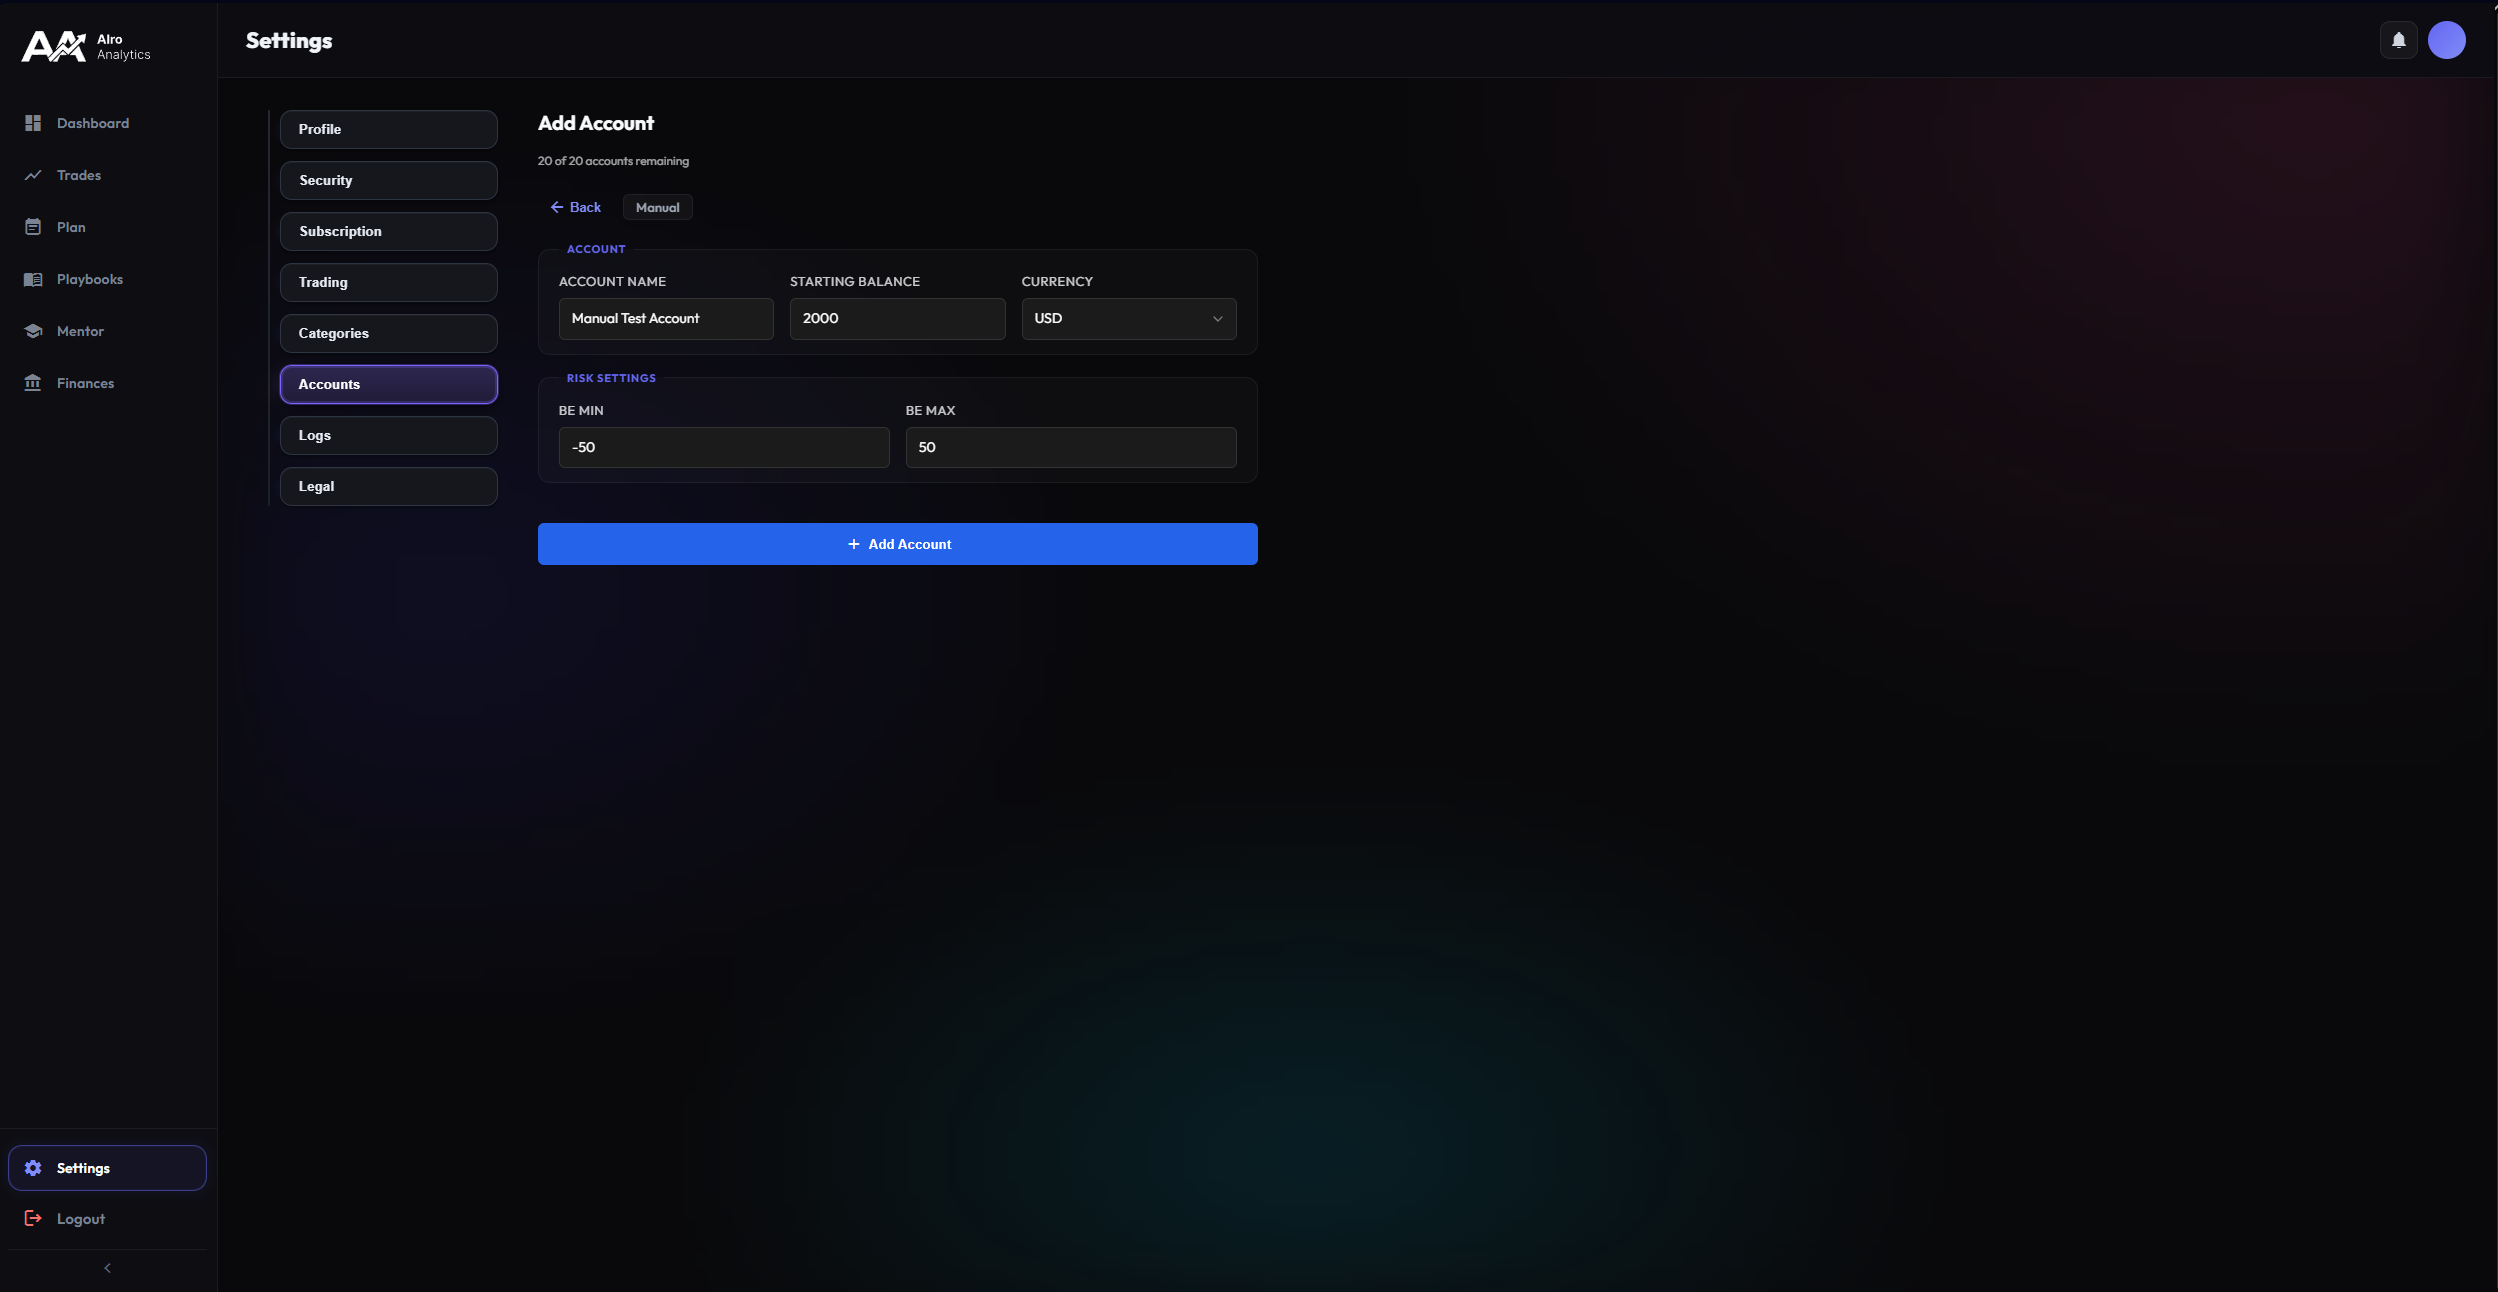
Manual Accounts
For backtesting or special strategies: Create manual accounts with individual starting balances. These are ideal for simulating scenarios without risking real money.
- Select the "Manual" option.
- Assign a unique name.
- Define the starting balance for correct performance calculations.
You can easily recognize manual accounts in the overview by the bracket-like icon.
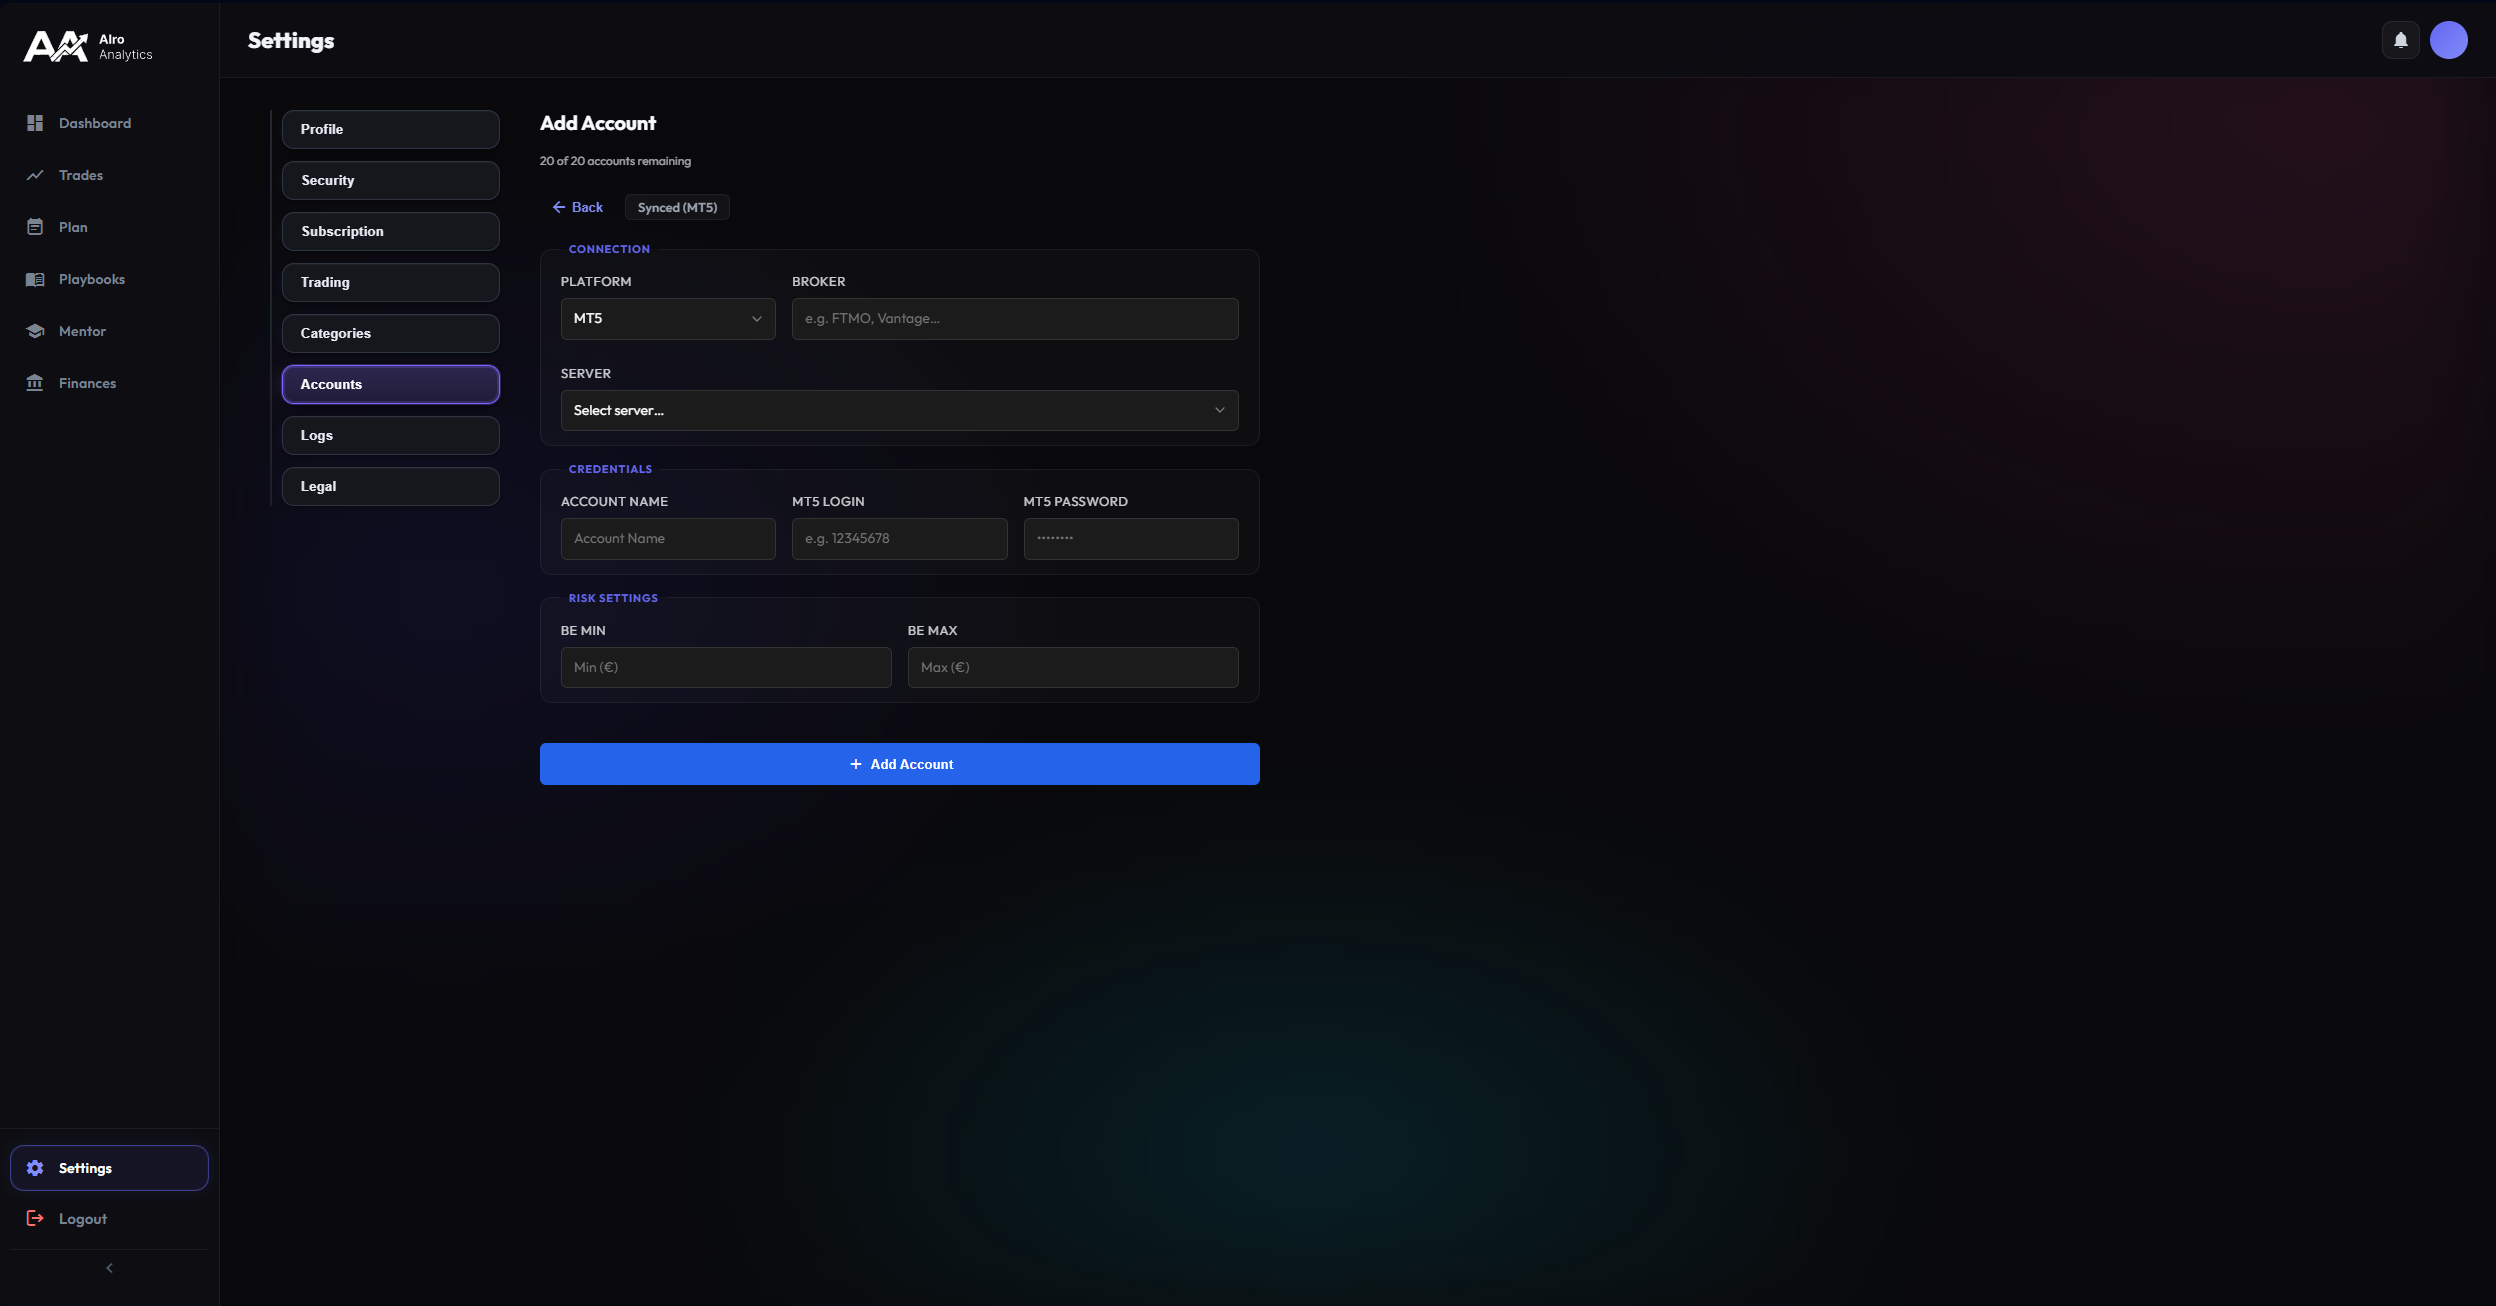
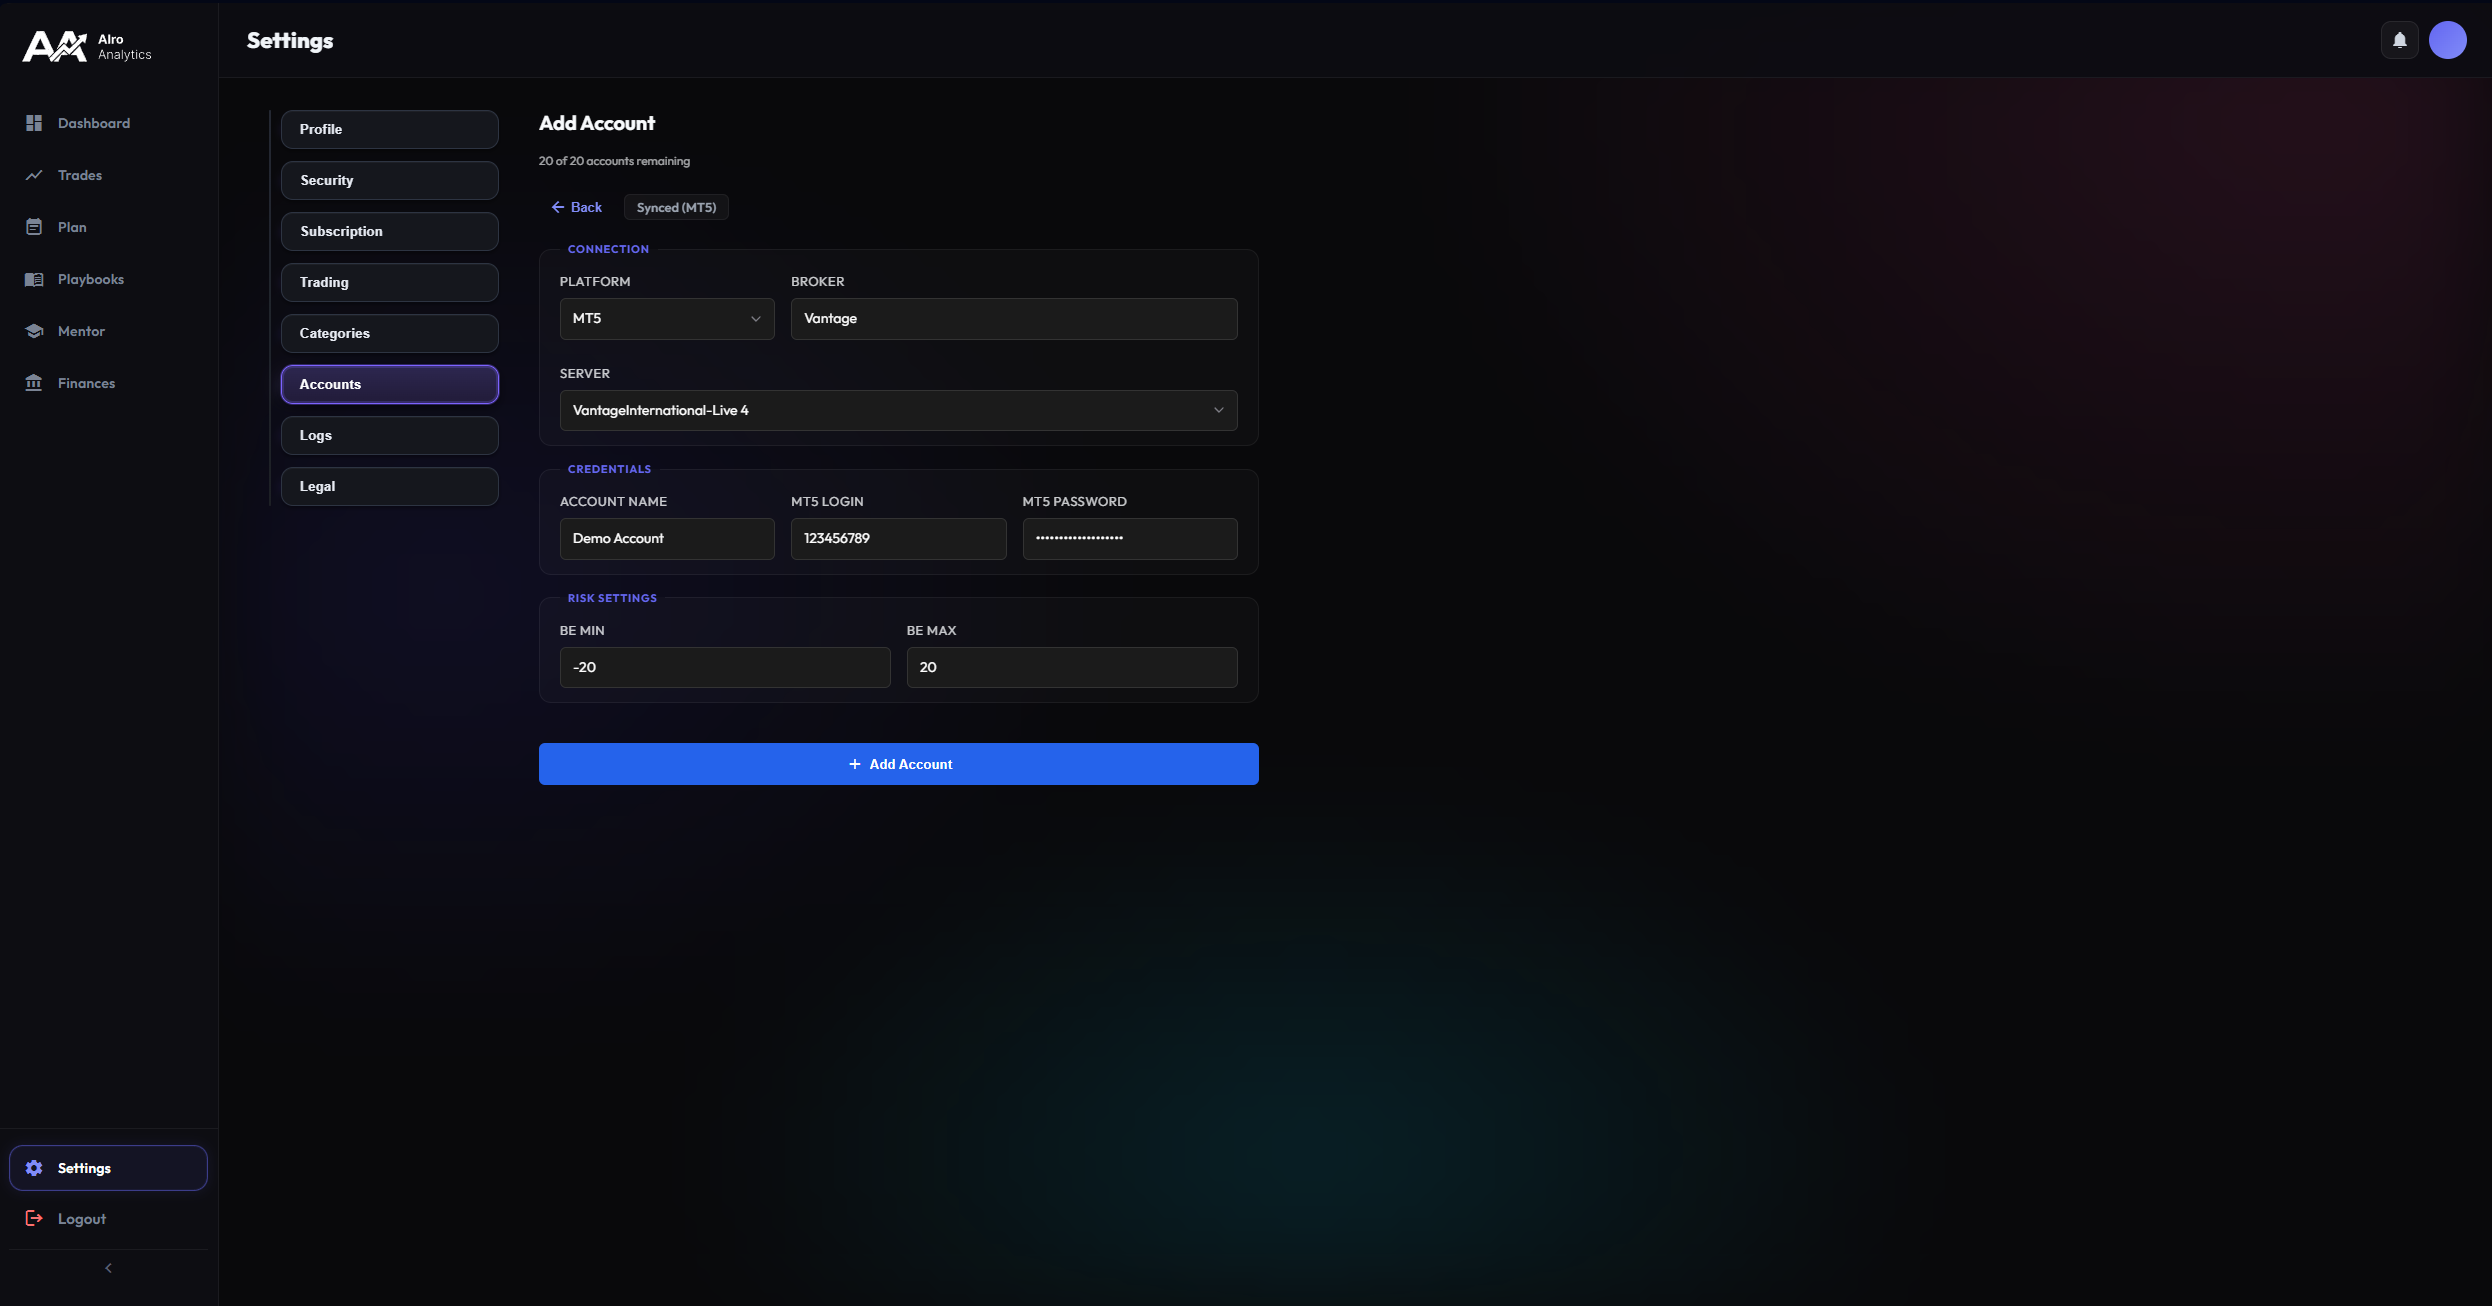
Synced Accounts
Maximum efficiency through automation. Connect your MetaTrader accounts directly. Our system imports your history and keeps new trades automatically synchronized.
We only need the Investor Password (Read-Only). This allows us to read trades but not execute orders. Your capital remains safe.
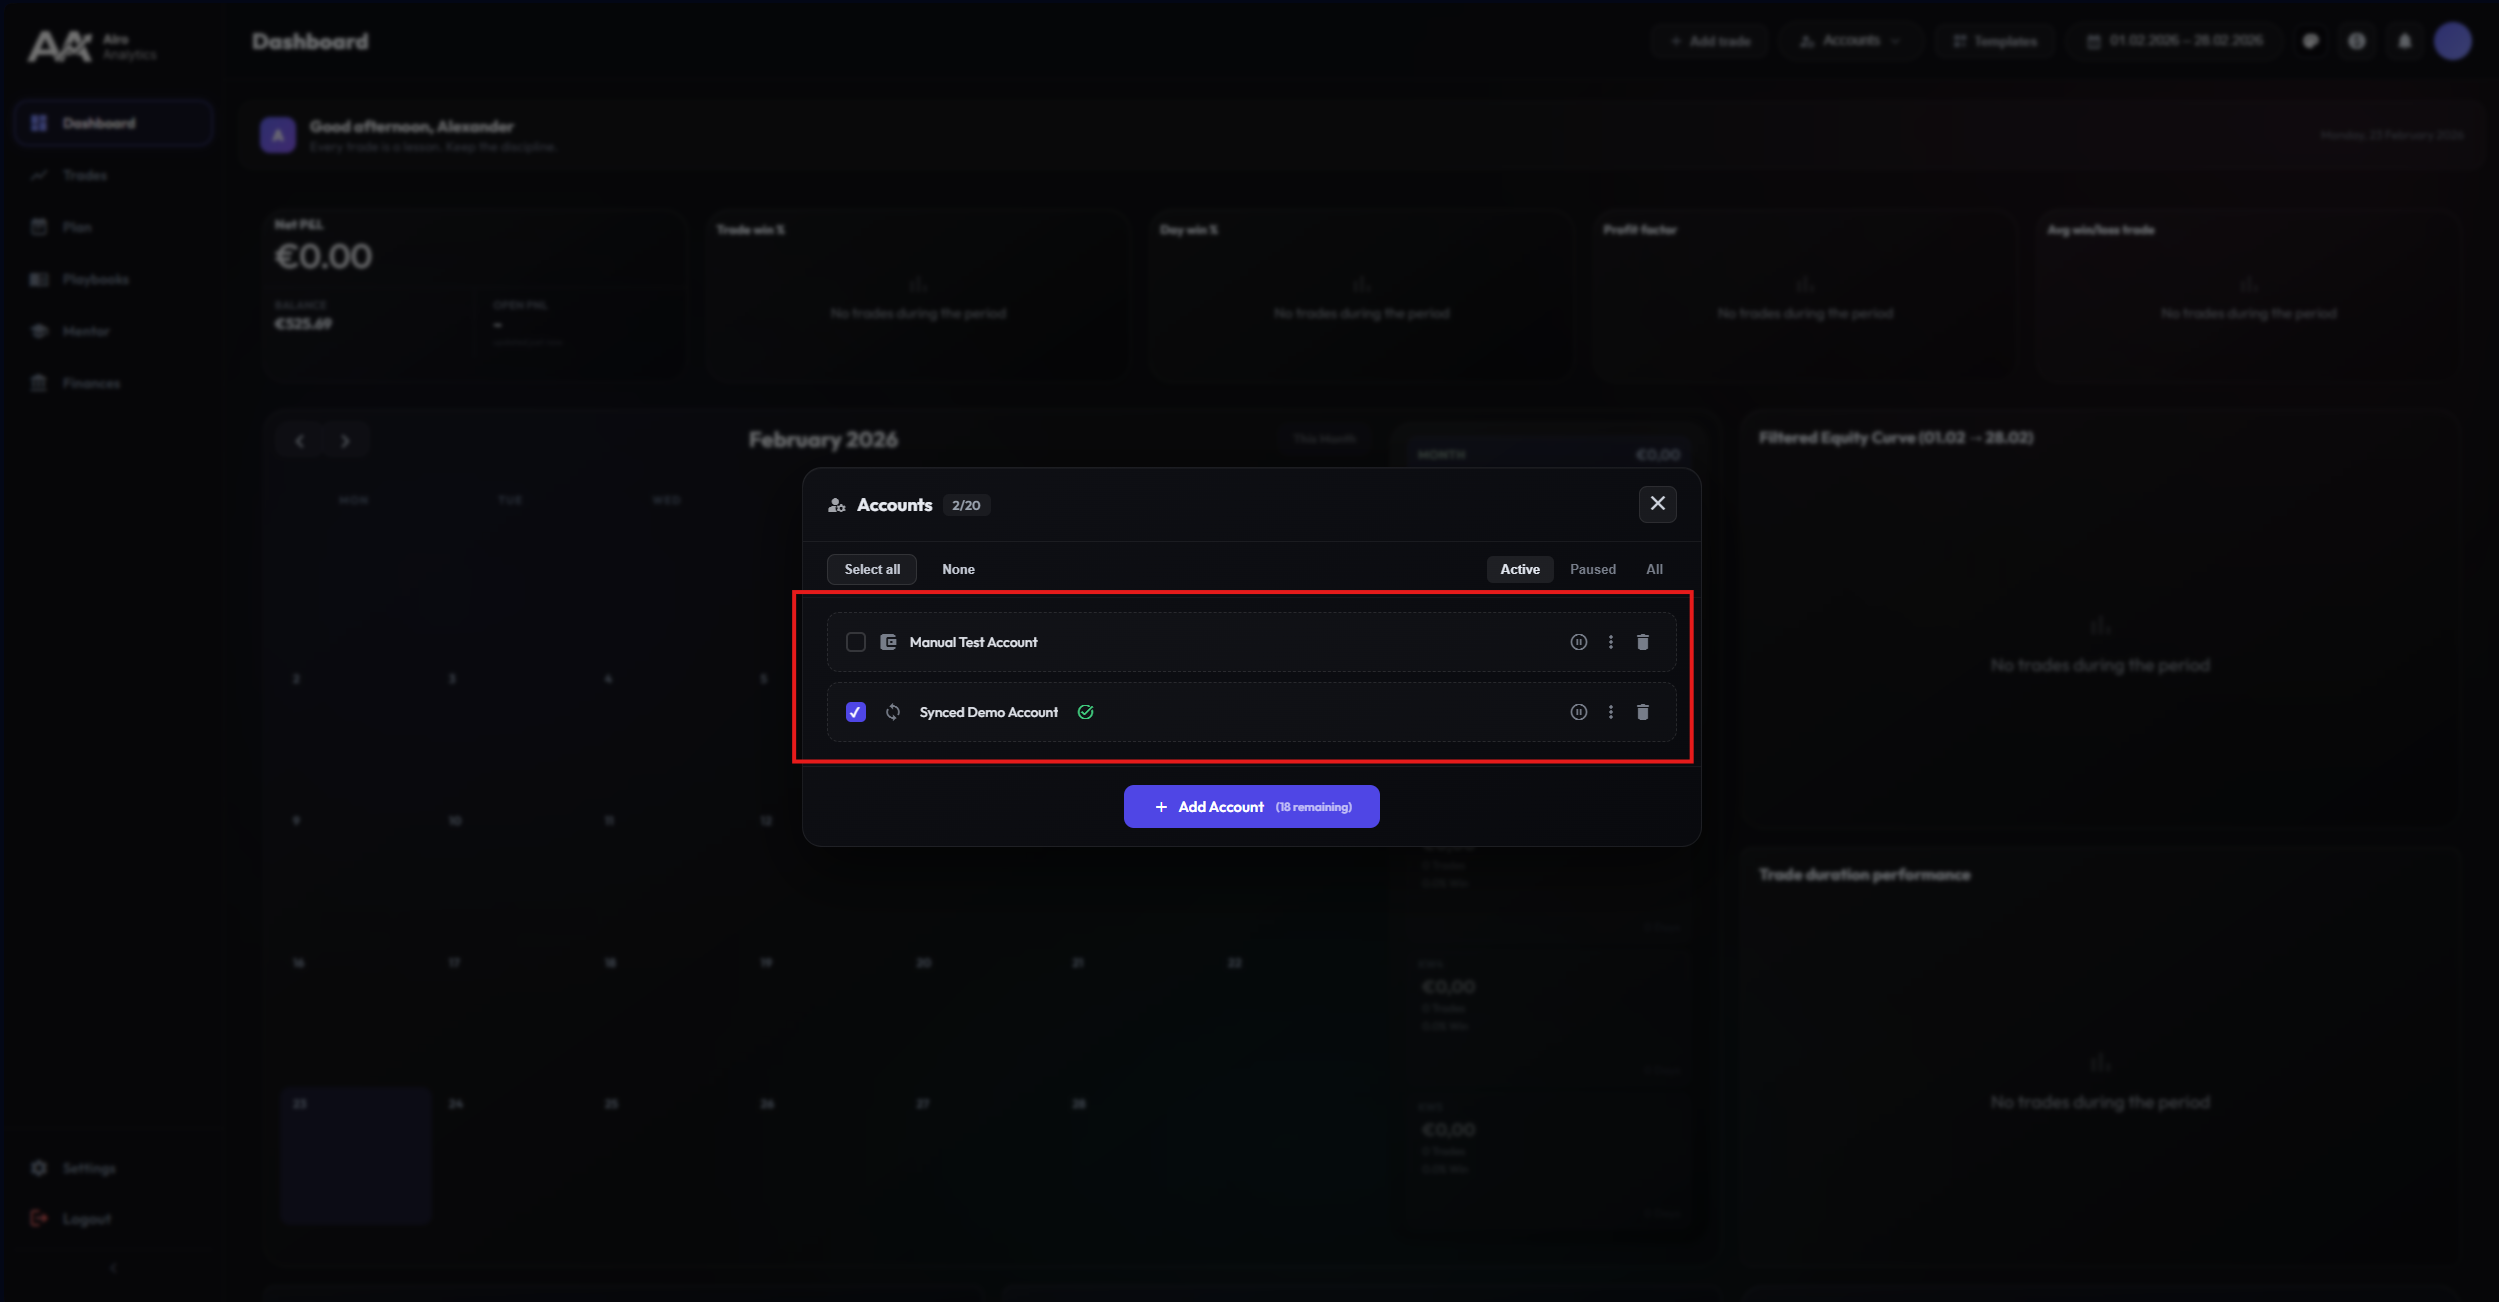
Status Indicators
Keep track of your connections. The status next to the account name informs you in real-time:
Queue
Import running
Success
Failed
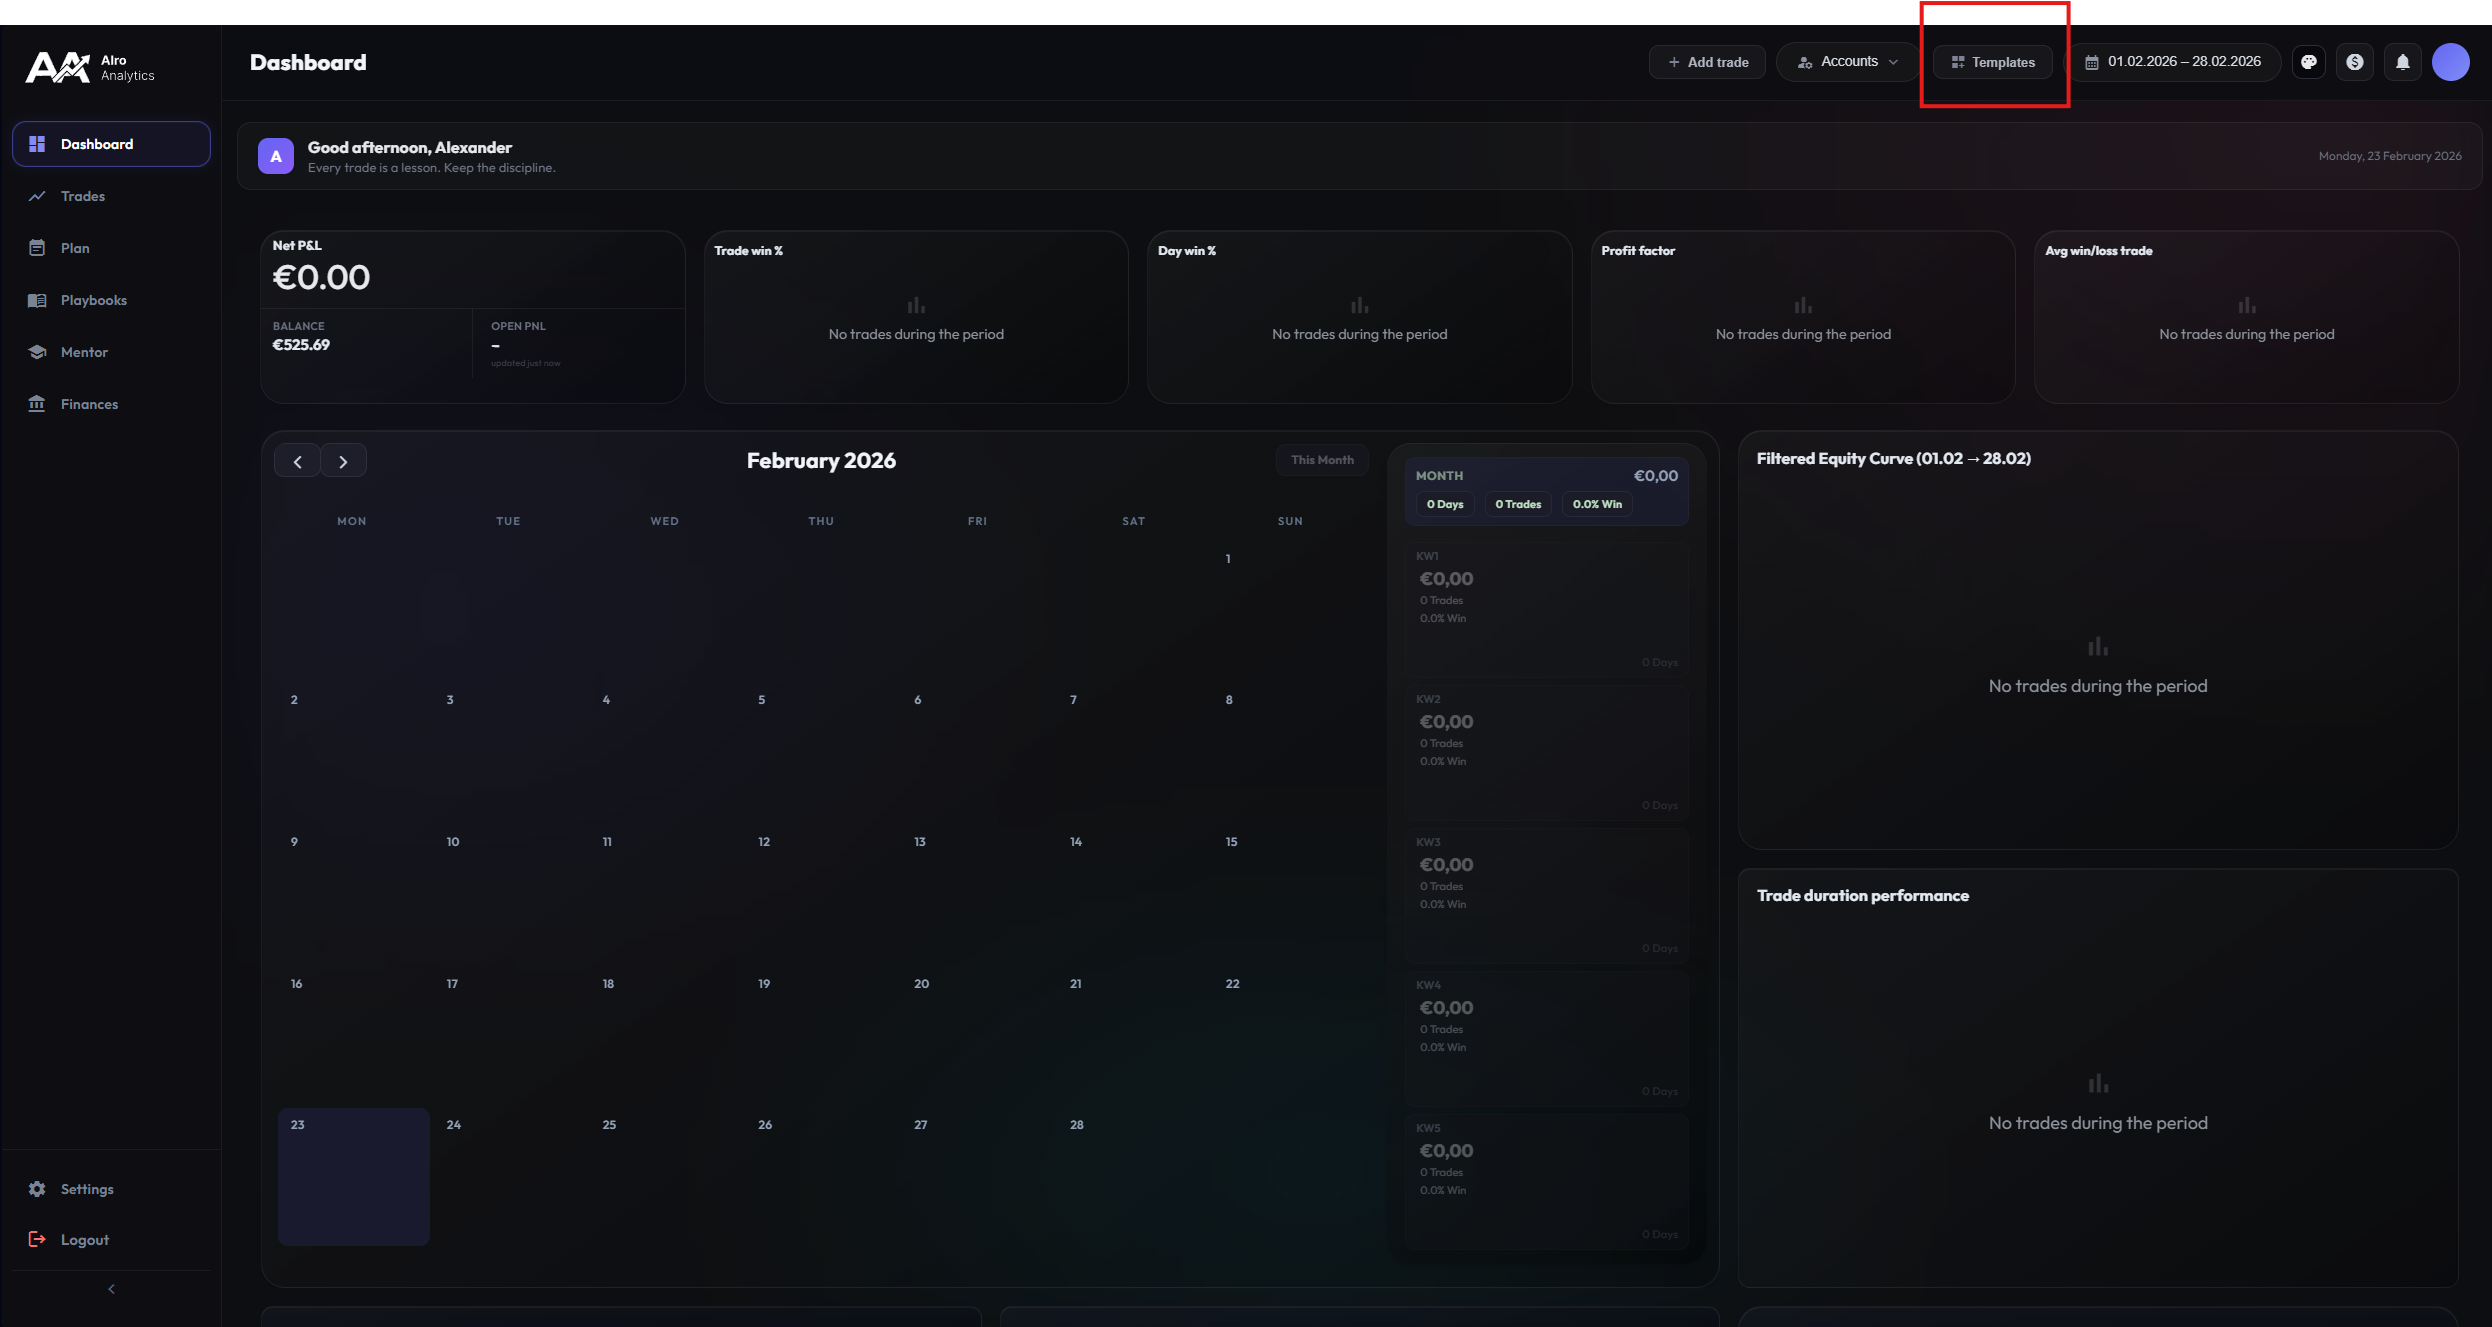
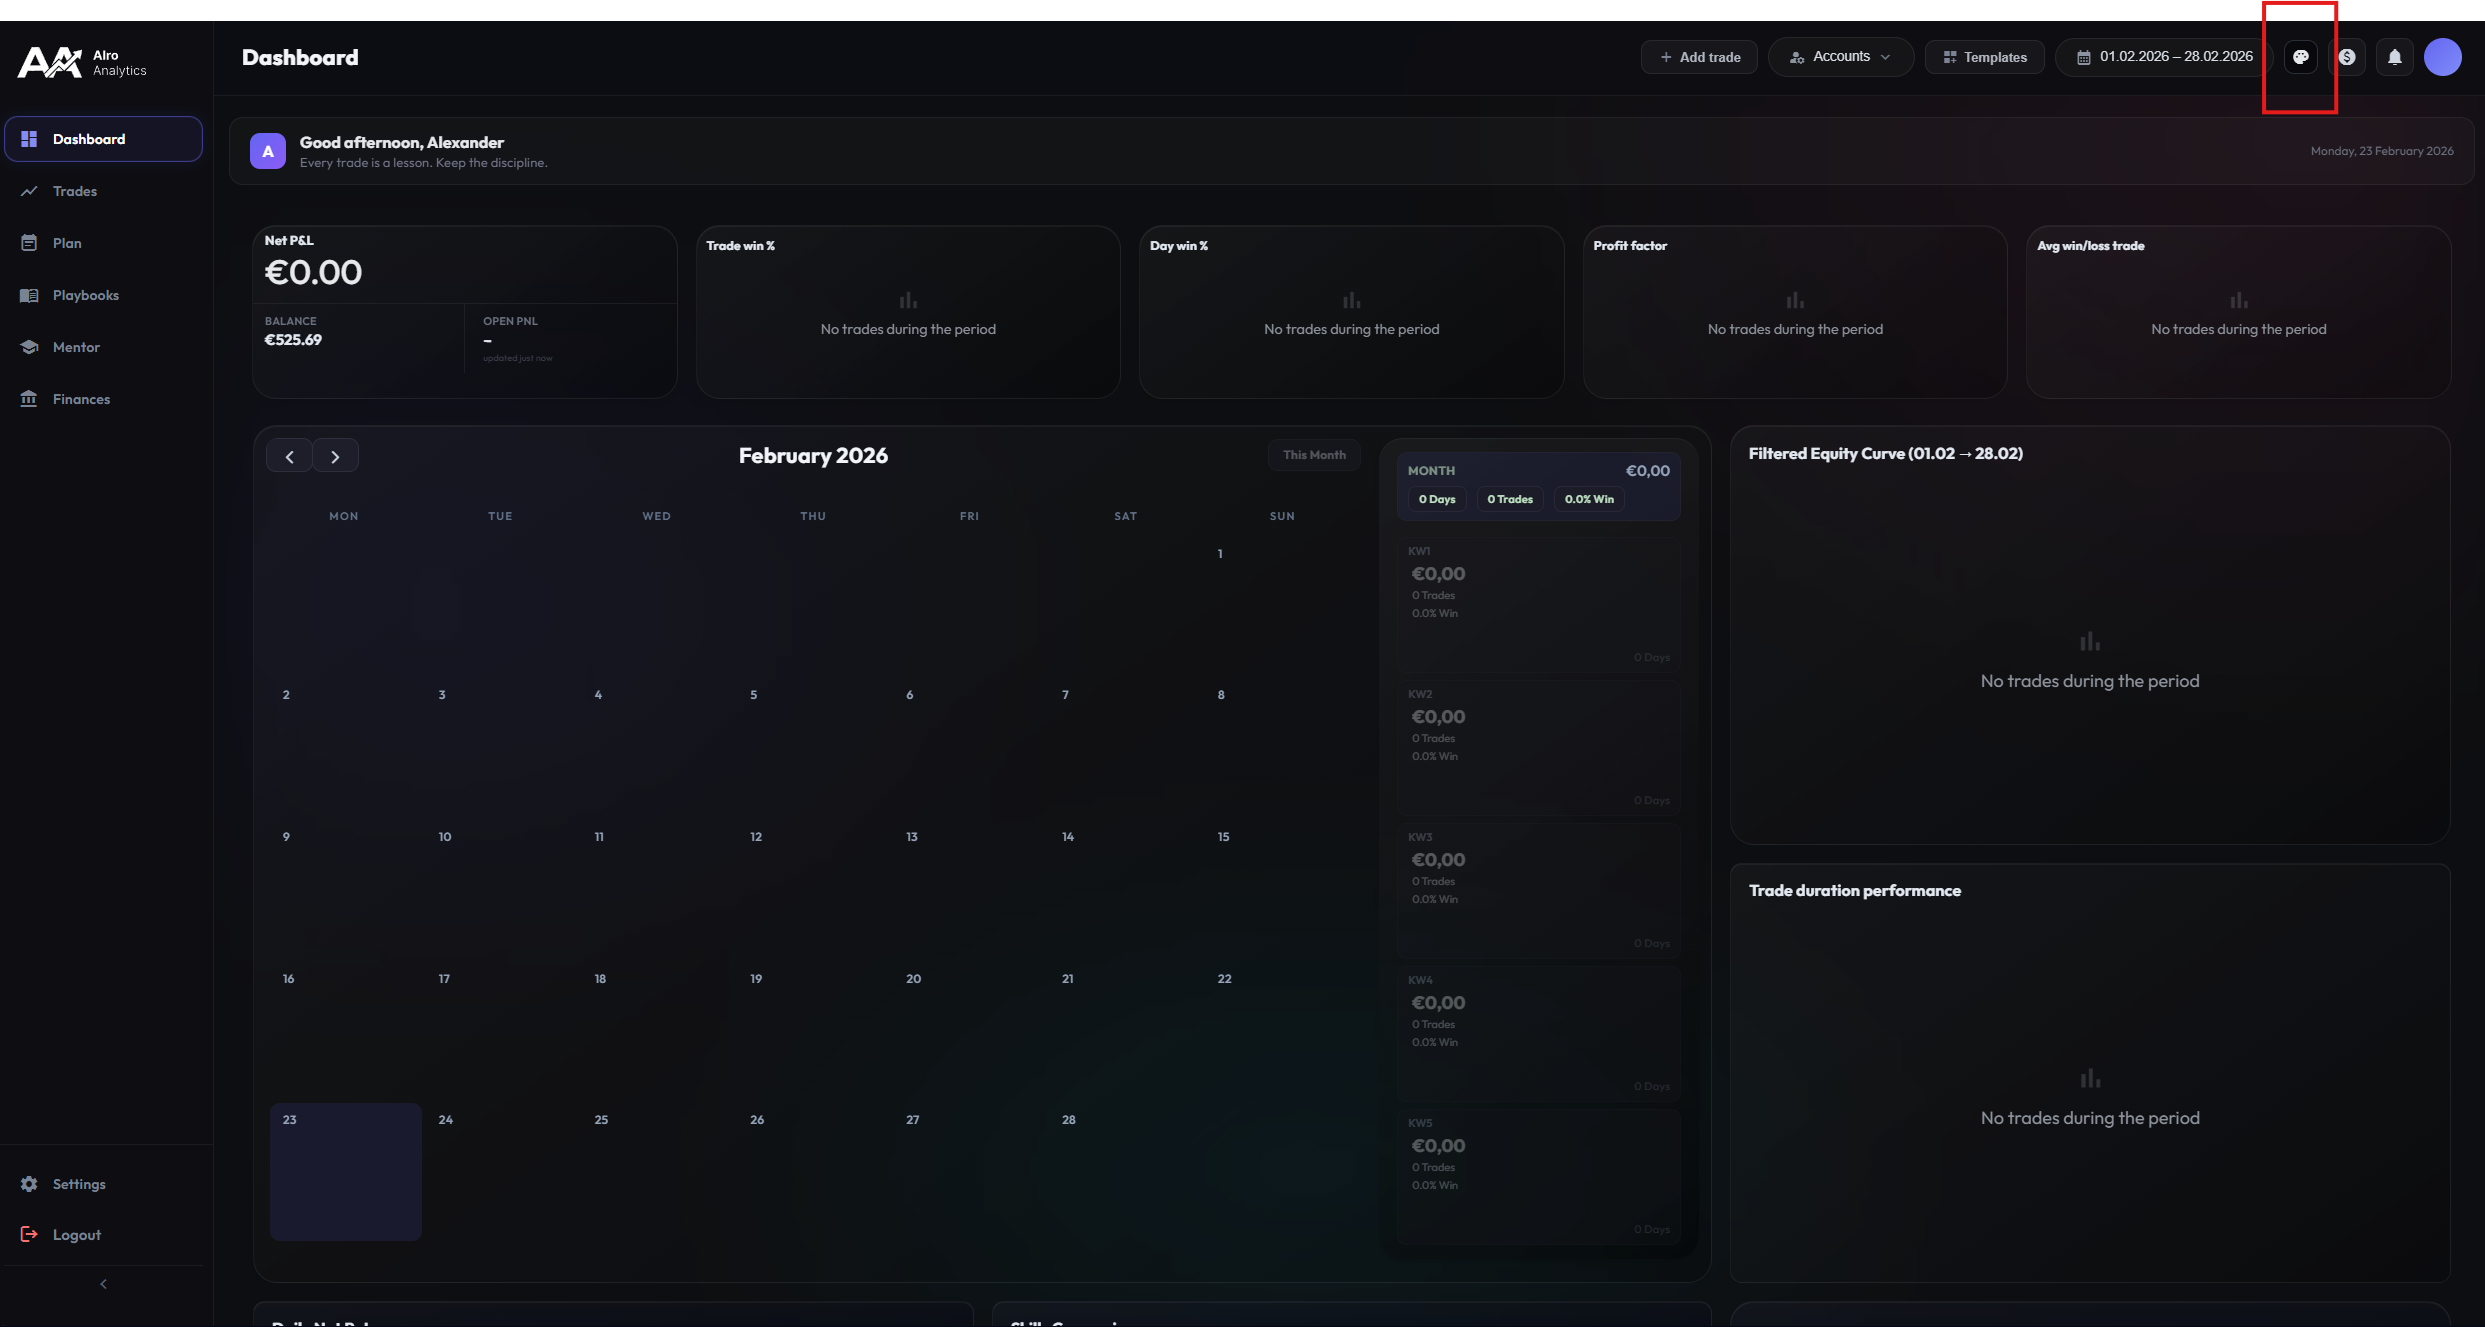
Templates and Themes
No trader is like the other. That's why Alro Analytics adapts to you, not the other way around. Design your personal trading workspace.
Open the template management via the configuration button. Here you have full control over your layouts:
Create New Template
Build your dashboard from scratch. Our drag-and-drop editor makes it easy:
- Select the most important KPIs (e.g. Winrate, Profit Factor) in the upper area.
- Place widgets (charts, lists, calendars) in the lower area.
- Adjust the size of the widgets by dragging the bottom right corner.
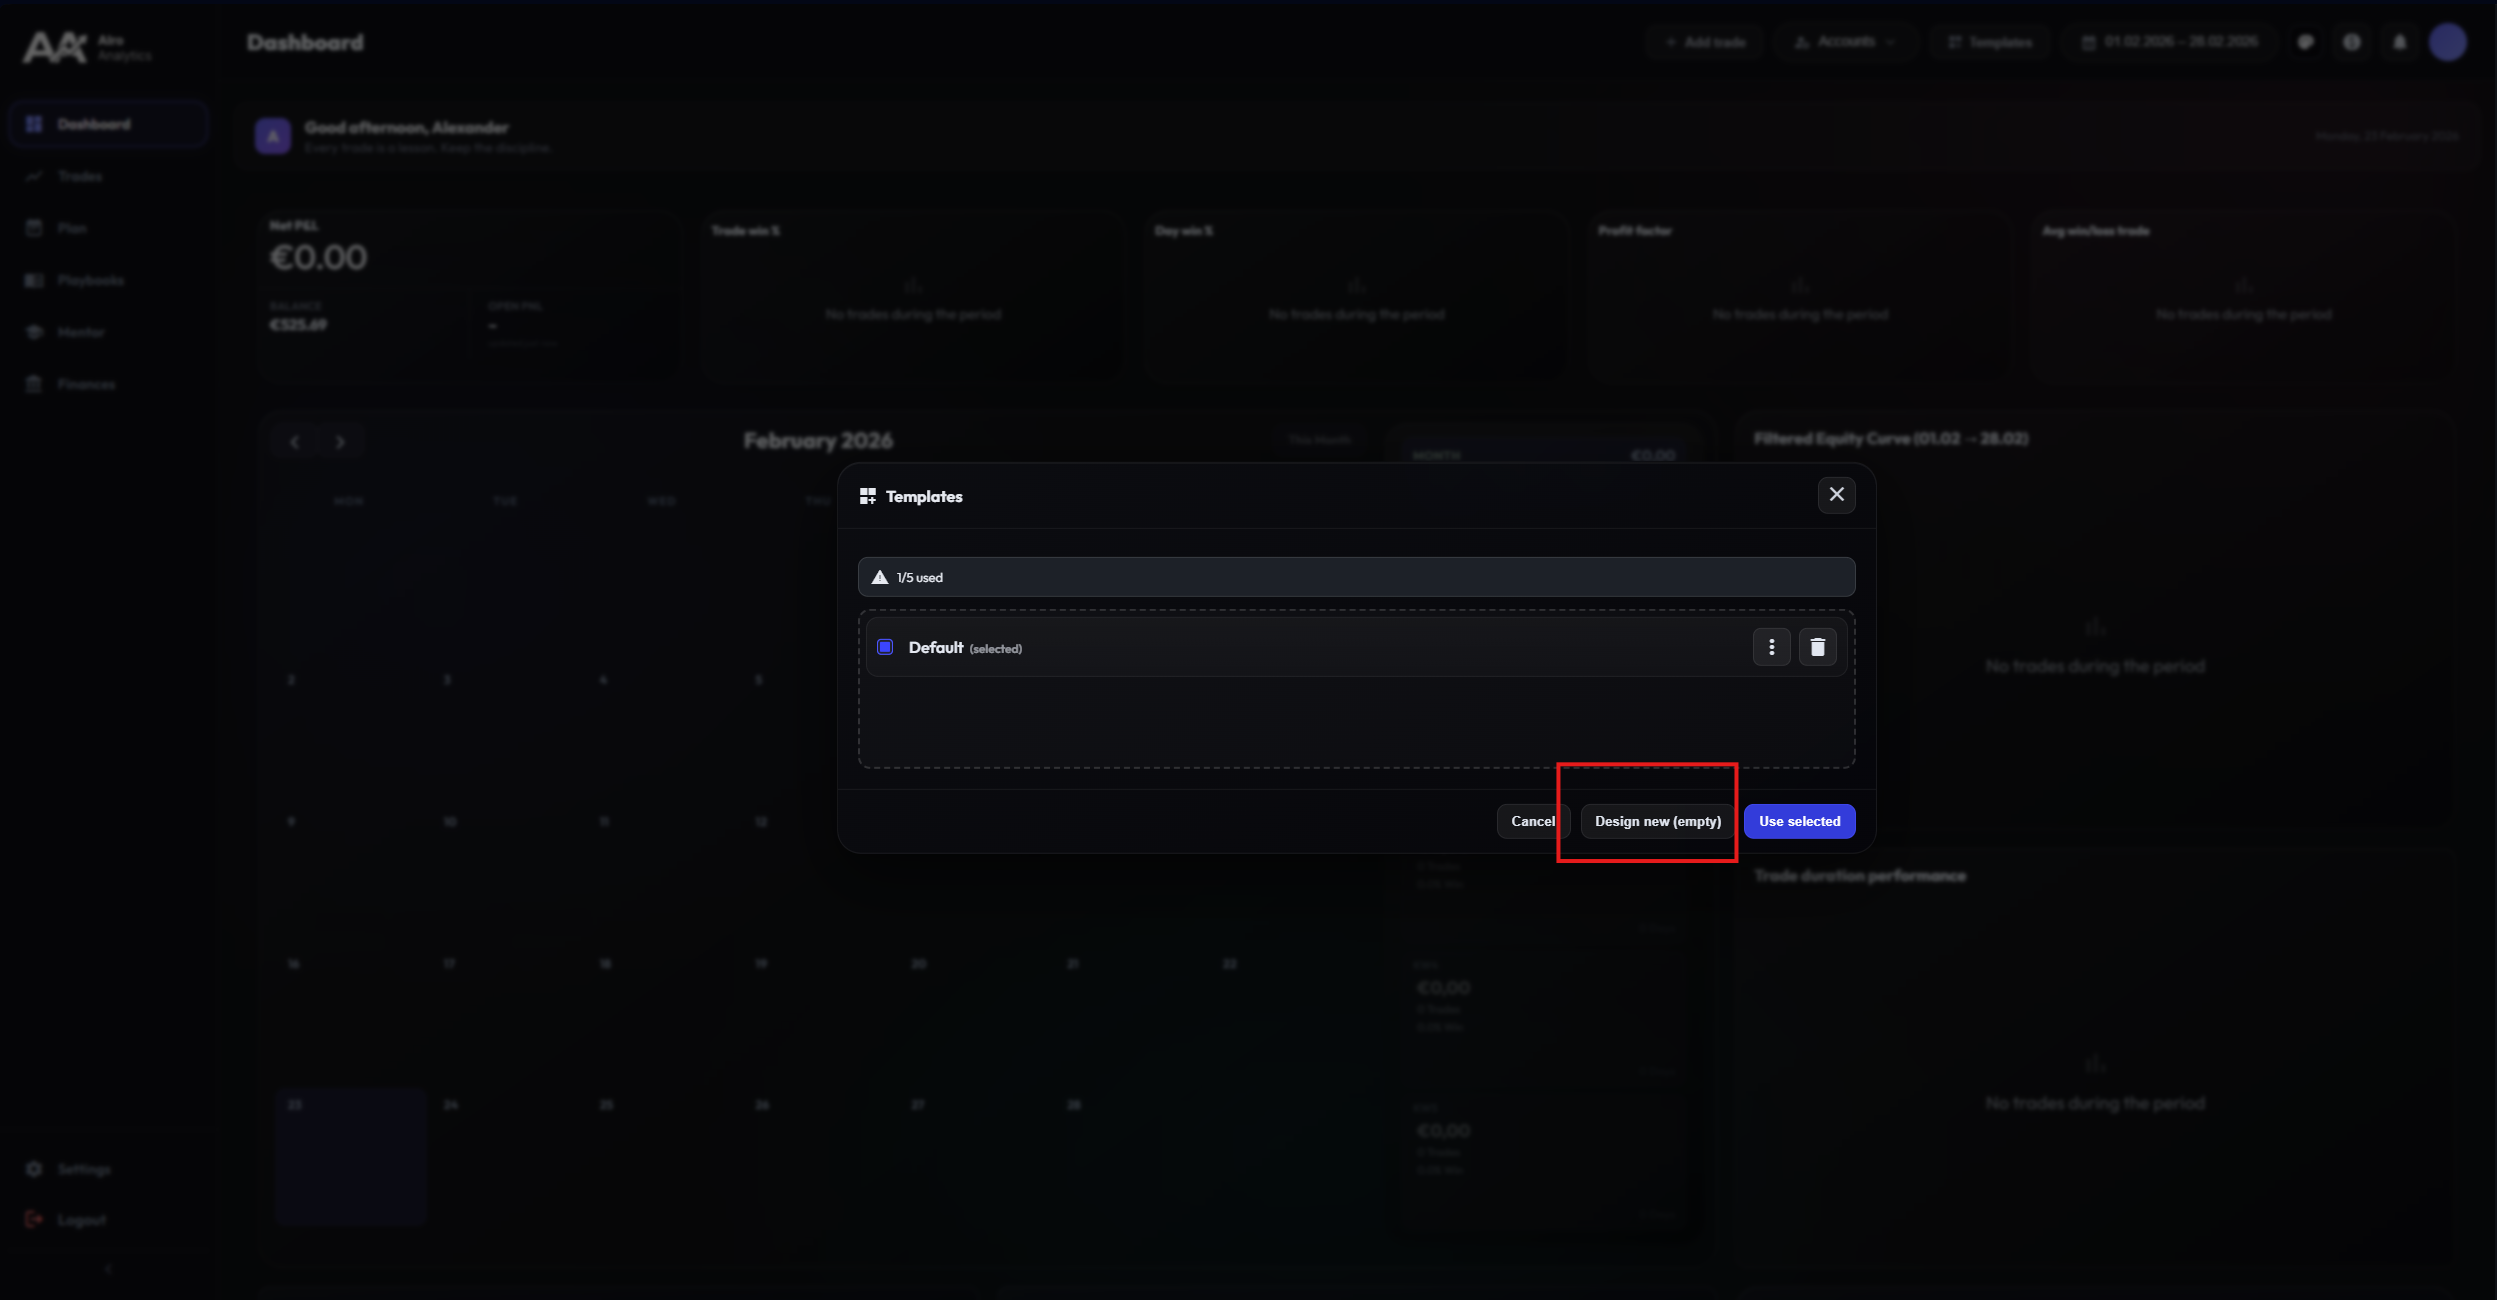
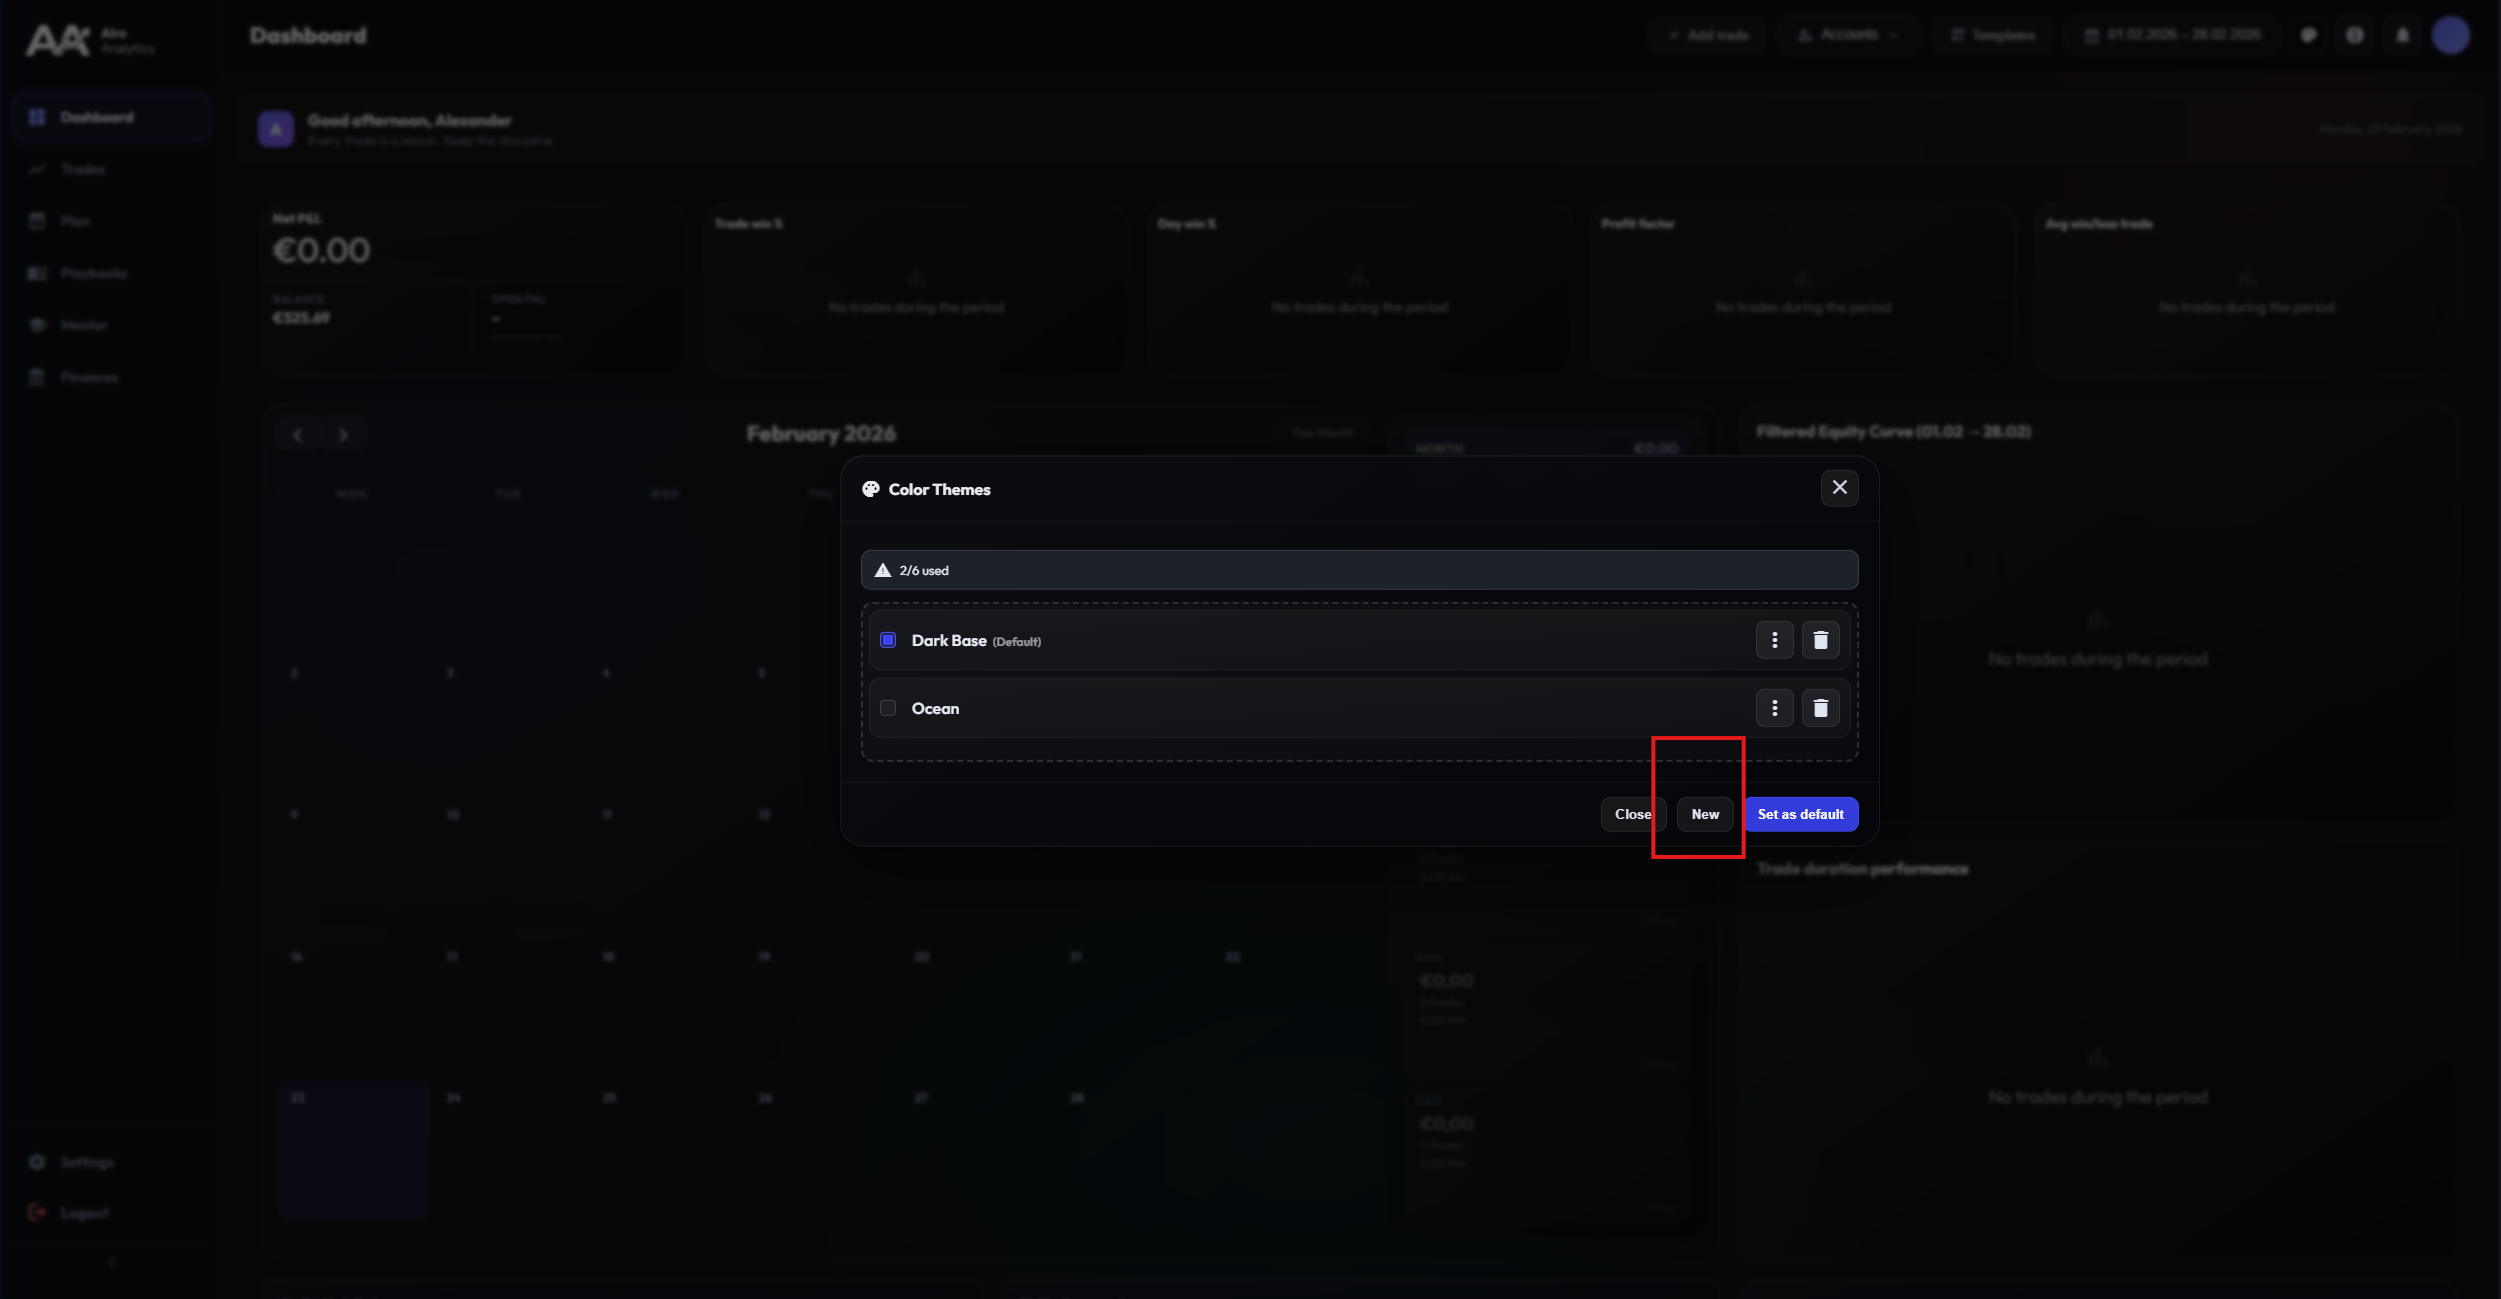
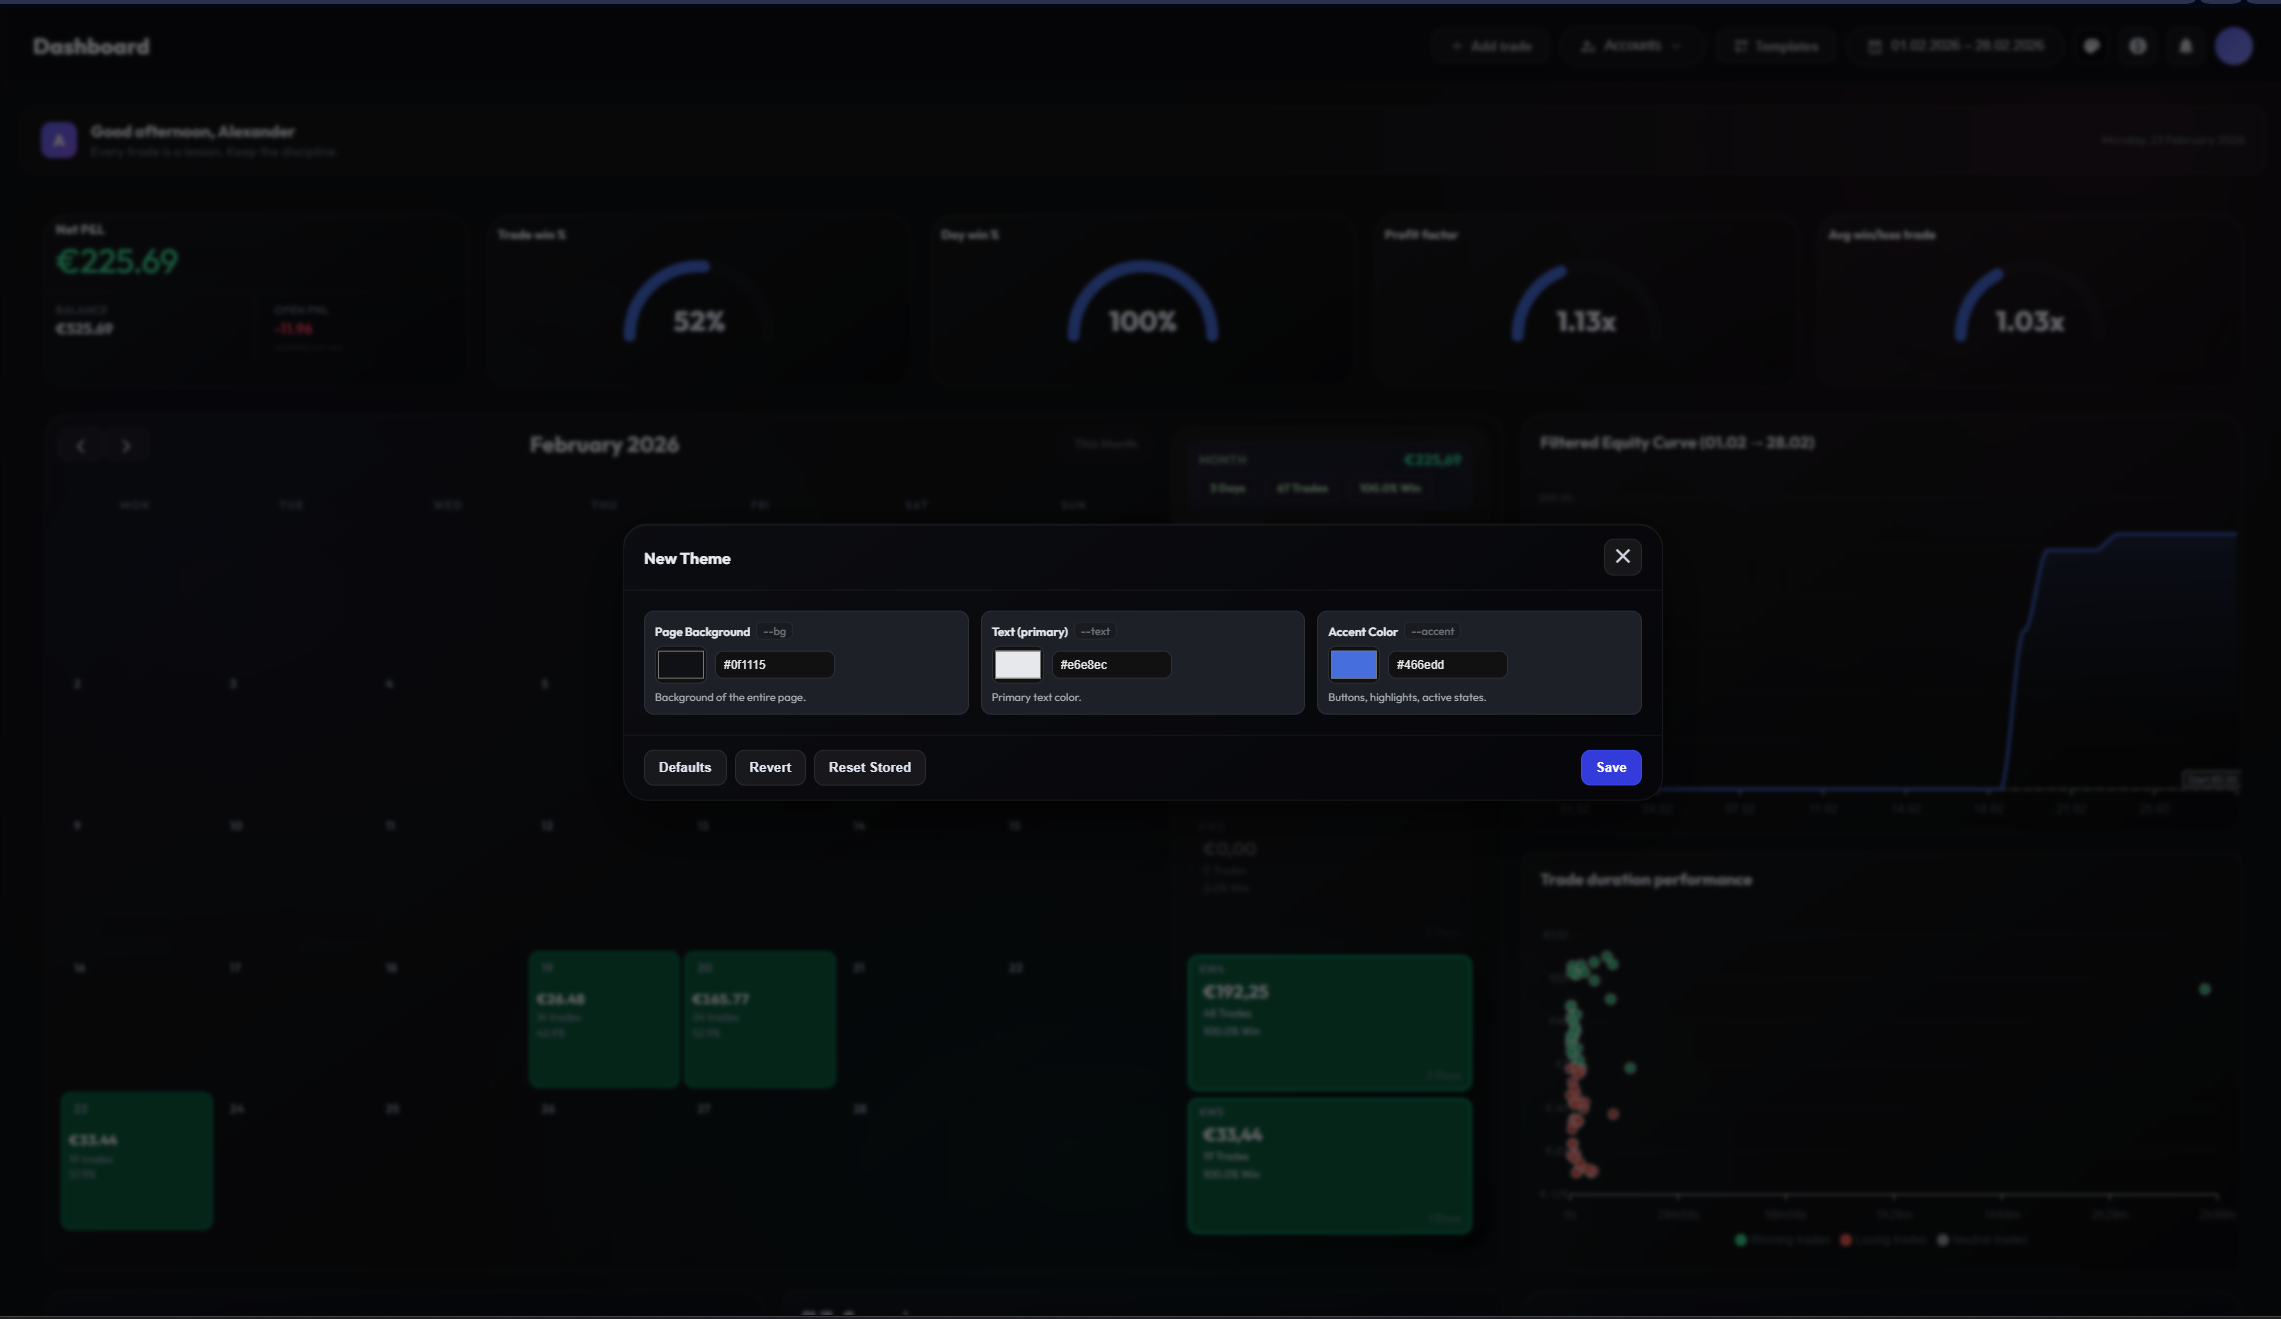
Themes & Design
Optimal readability in any environment. Whether Dark Mode for long nights or high-contrast themes for the day – adapt the visual experience to your preferences.
Click on the three dots to edit a theme or create a completely new color scheme.
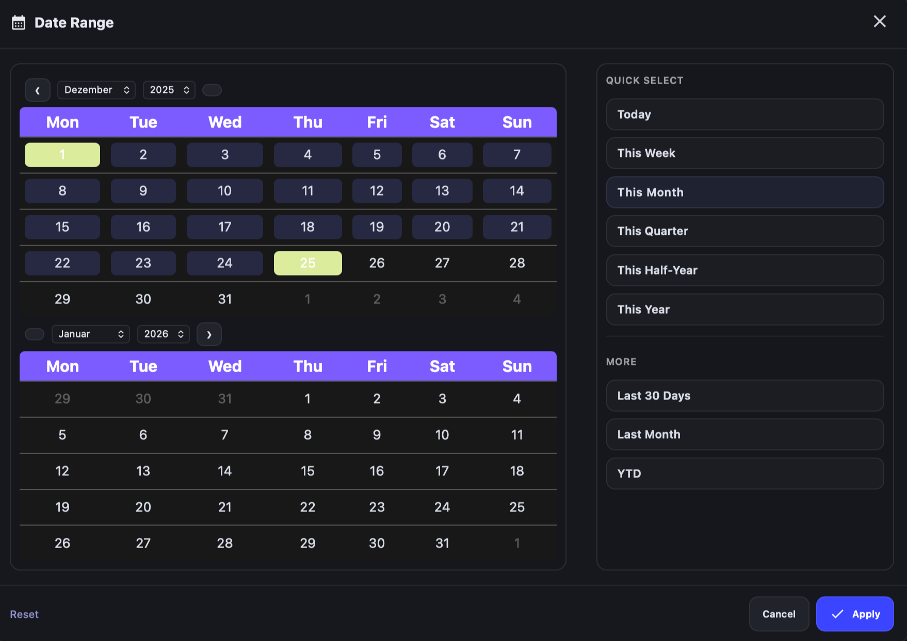
Date Filter
Precision on the timeline. Analyze your performance over any period – from a single day to your entire career.
Use the date picker at the top right to define specific periods, or use the quick selection options (e.g. "Last 30 days", "This year") for maximum efficiency.
Quick Selection
For fast access, use the pre-built time ranges. One click sets the filter instantly – no manual start/end dates needed.
- Presets: Choose from "Today", "This Week", "This Month", "Last 30 Days", or "This Year".
- All Time: Select "All Time" to analyze your complete trading history across all accounts.
- Instant update: Your dashboard, KPIs, and all widgets update immediately after selection.
Custom Range
Need precision? Click on the calendar icon to open the date picker. Select a custom start and end date to isolate specific trading sessions, events, or review periods.
Use date filters to compare performance across different periods. For instance, filter last month's trades to identify patterns, then compare with the previous month to track your improvement over time.
All Trades
Your digital trading journal. The "All Trades" view is the heart of your database. All information flows together here.
This table offers more than just an overview. It is a powerful analysis tool:
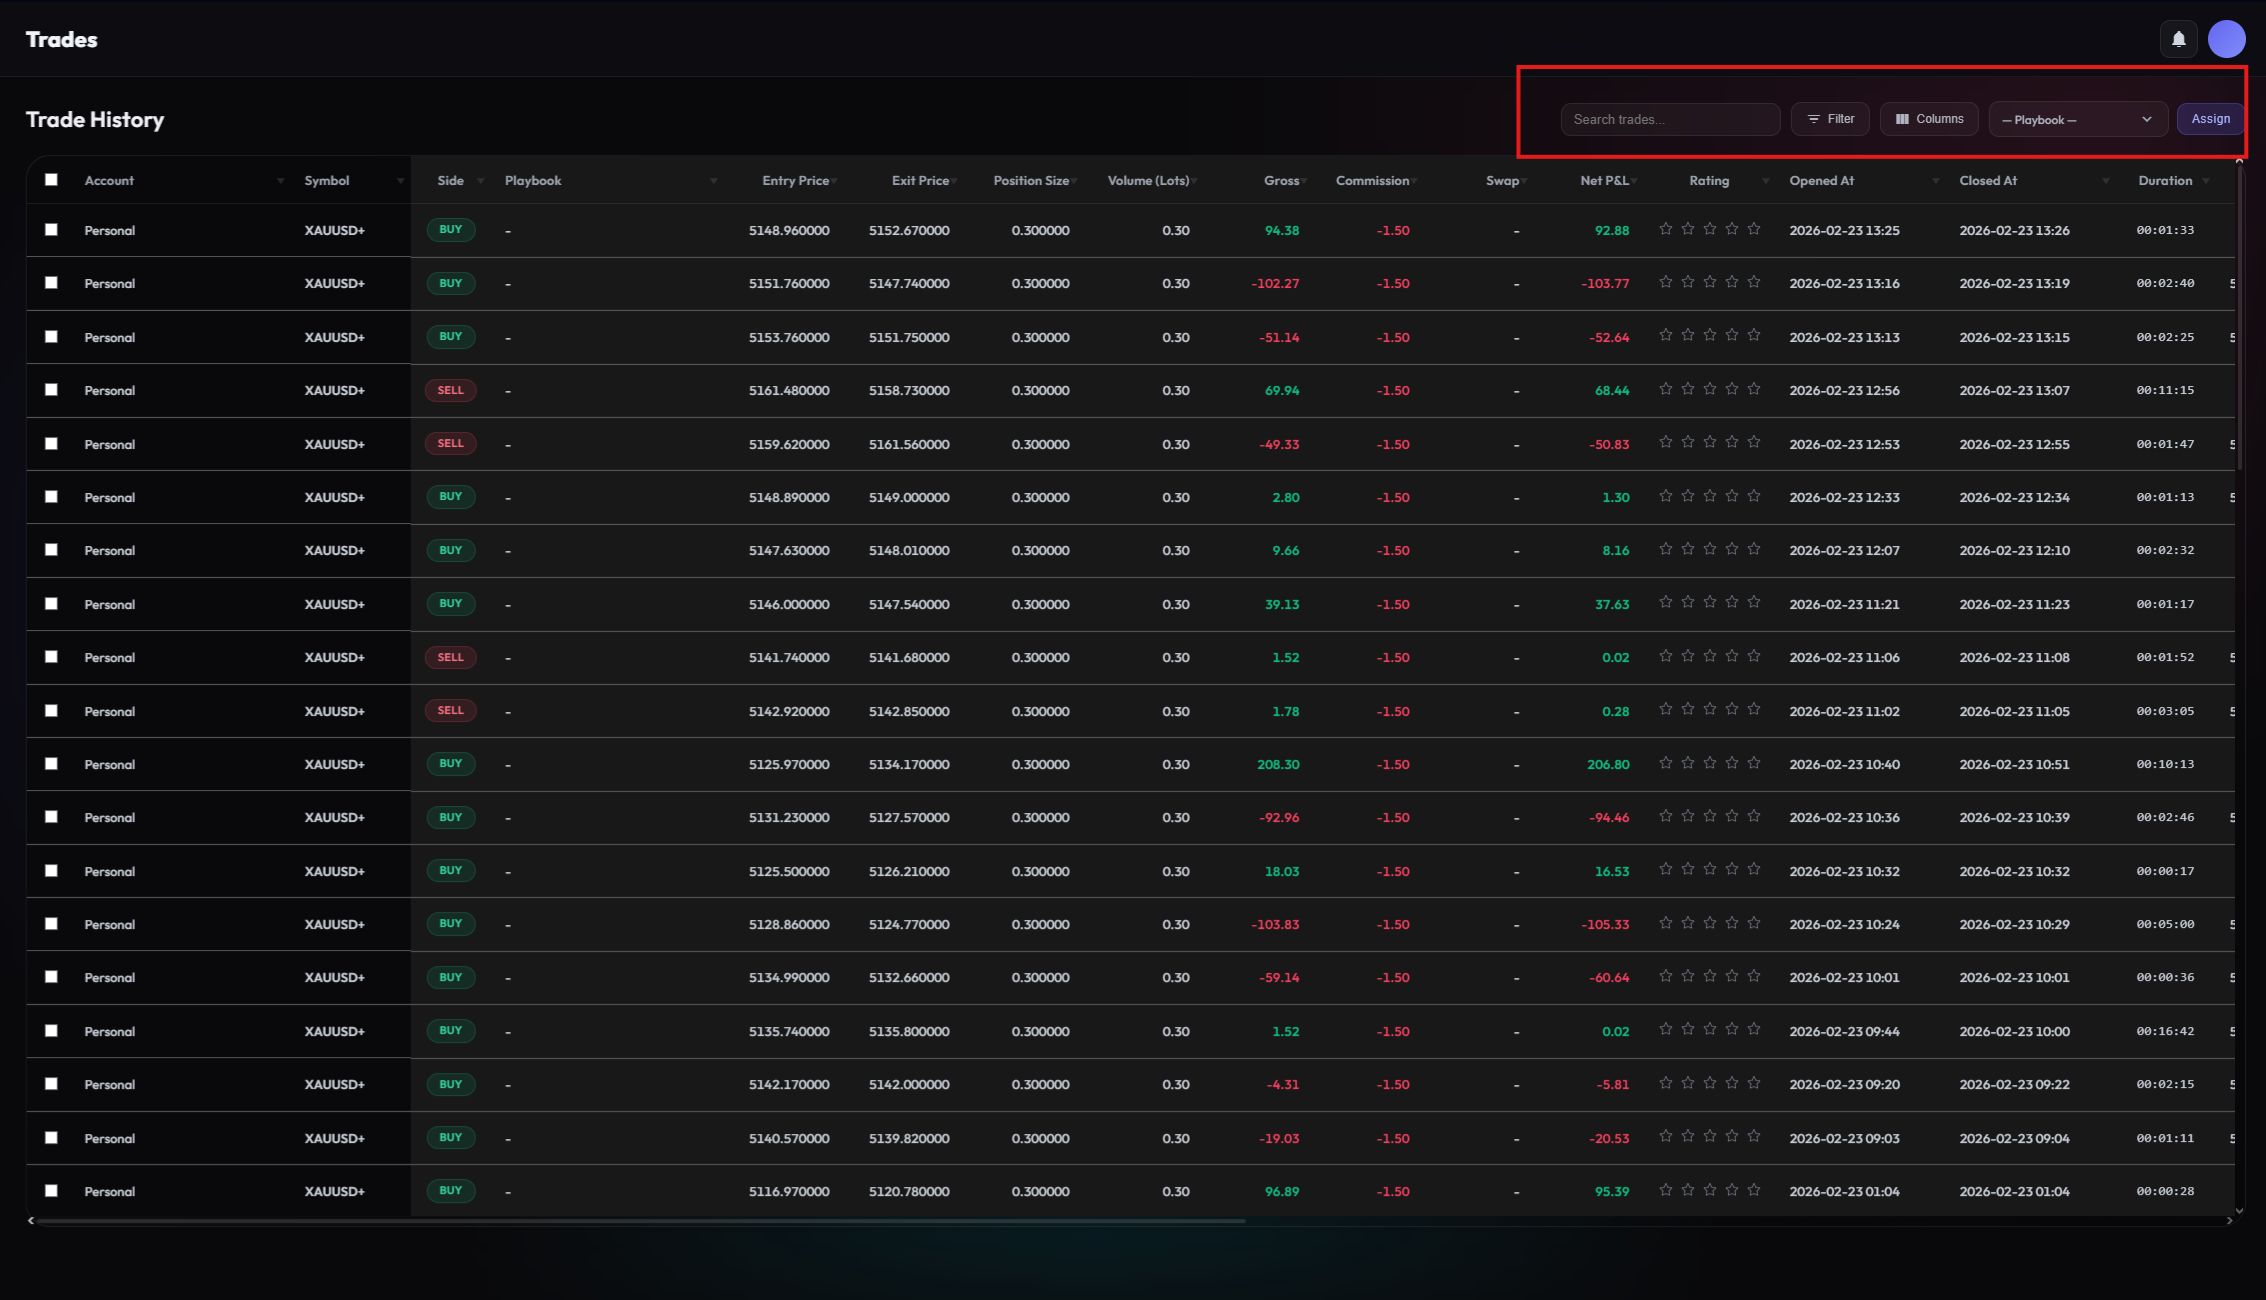
Powerful Filters
Slice your data any way you want. The filter system lets you isolate exactly the trades you need to analyze:
- By Instrument: Focus on a specific symbol (e.g. EURUSD, Gold, NAS100) to see how you perform with that asset.
- By Direction: Filter for Long or Short trades only to identify directional biases in your trading.
- By Result: Show only winning or losing trades to study what differentiates your best from your worst executions.
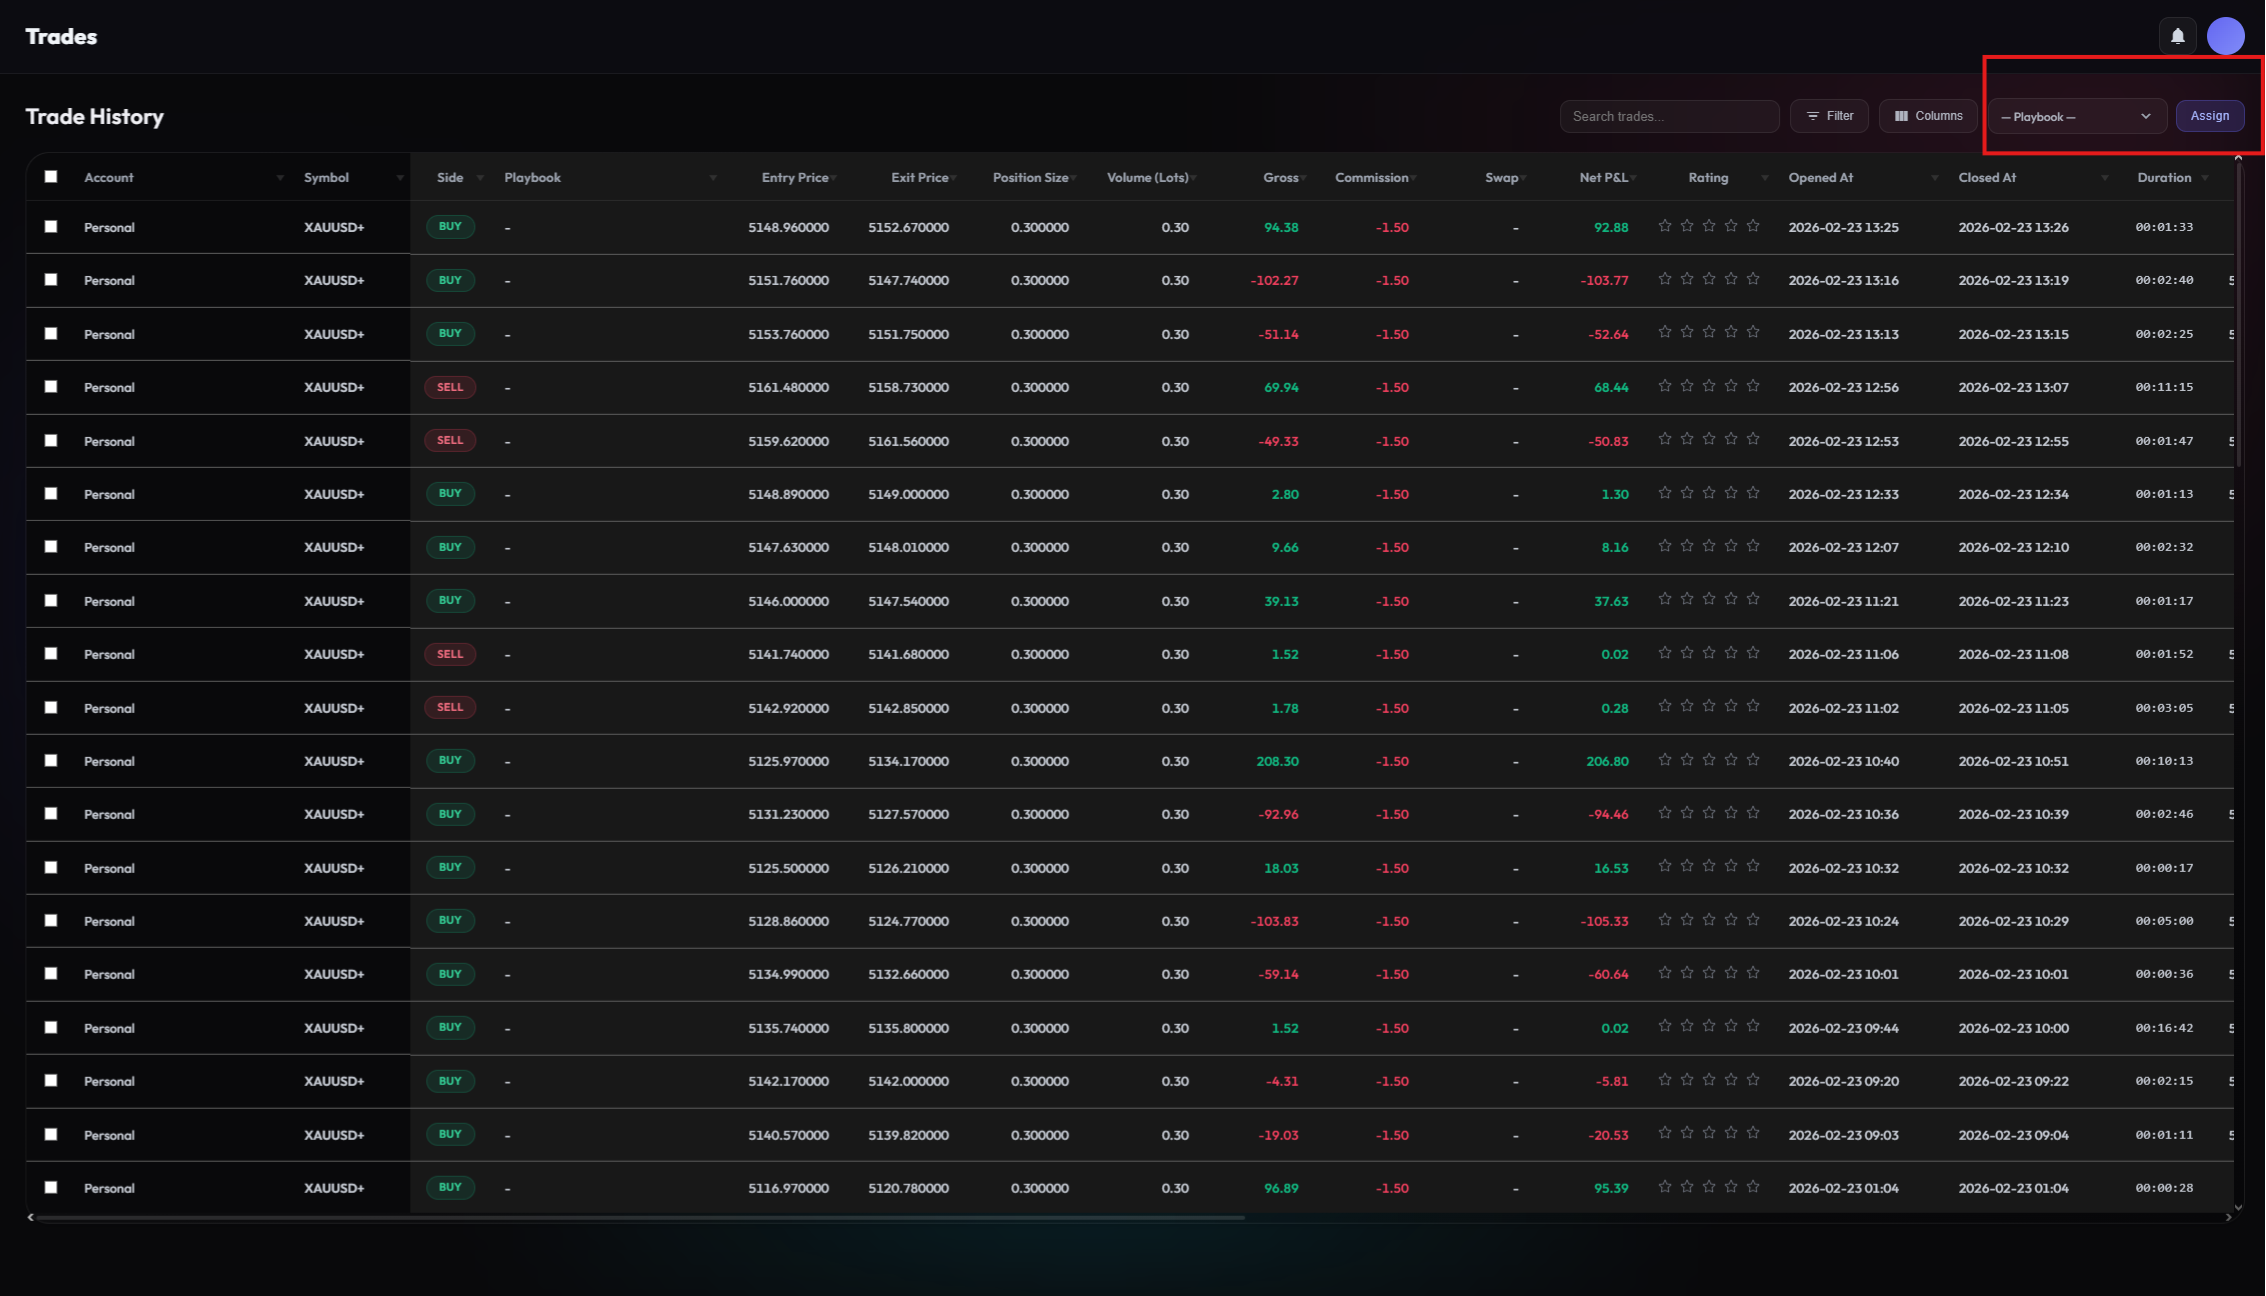
Organize & Assign
Select multiple trades using the checkboxes and perform bulk actions. Assign them to a Playbook with one click, or add tags to group related trades together. This turns a raw list into an organized knowledge base.
Export Data
Need your data outside of Alro Analytics? Export the currently filtered view as a CSV file. This is perfect for creating custom reports, sharing data with a mentor, or building your own spreadsheets.
Combine the date filter with column filters for maximum precision. For example, filter "This Month" + "EURUSD" + "Long" to see exactly how your long EUR positions performed this month.
Trading Plan
Success can be planned. Prepare every trading day professionally. Define your goals, analyze the market and record your thoughts.
The "Plan" area helps you bring structure to your everyday life:
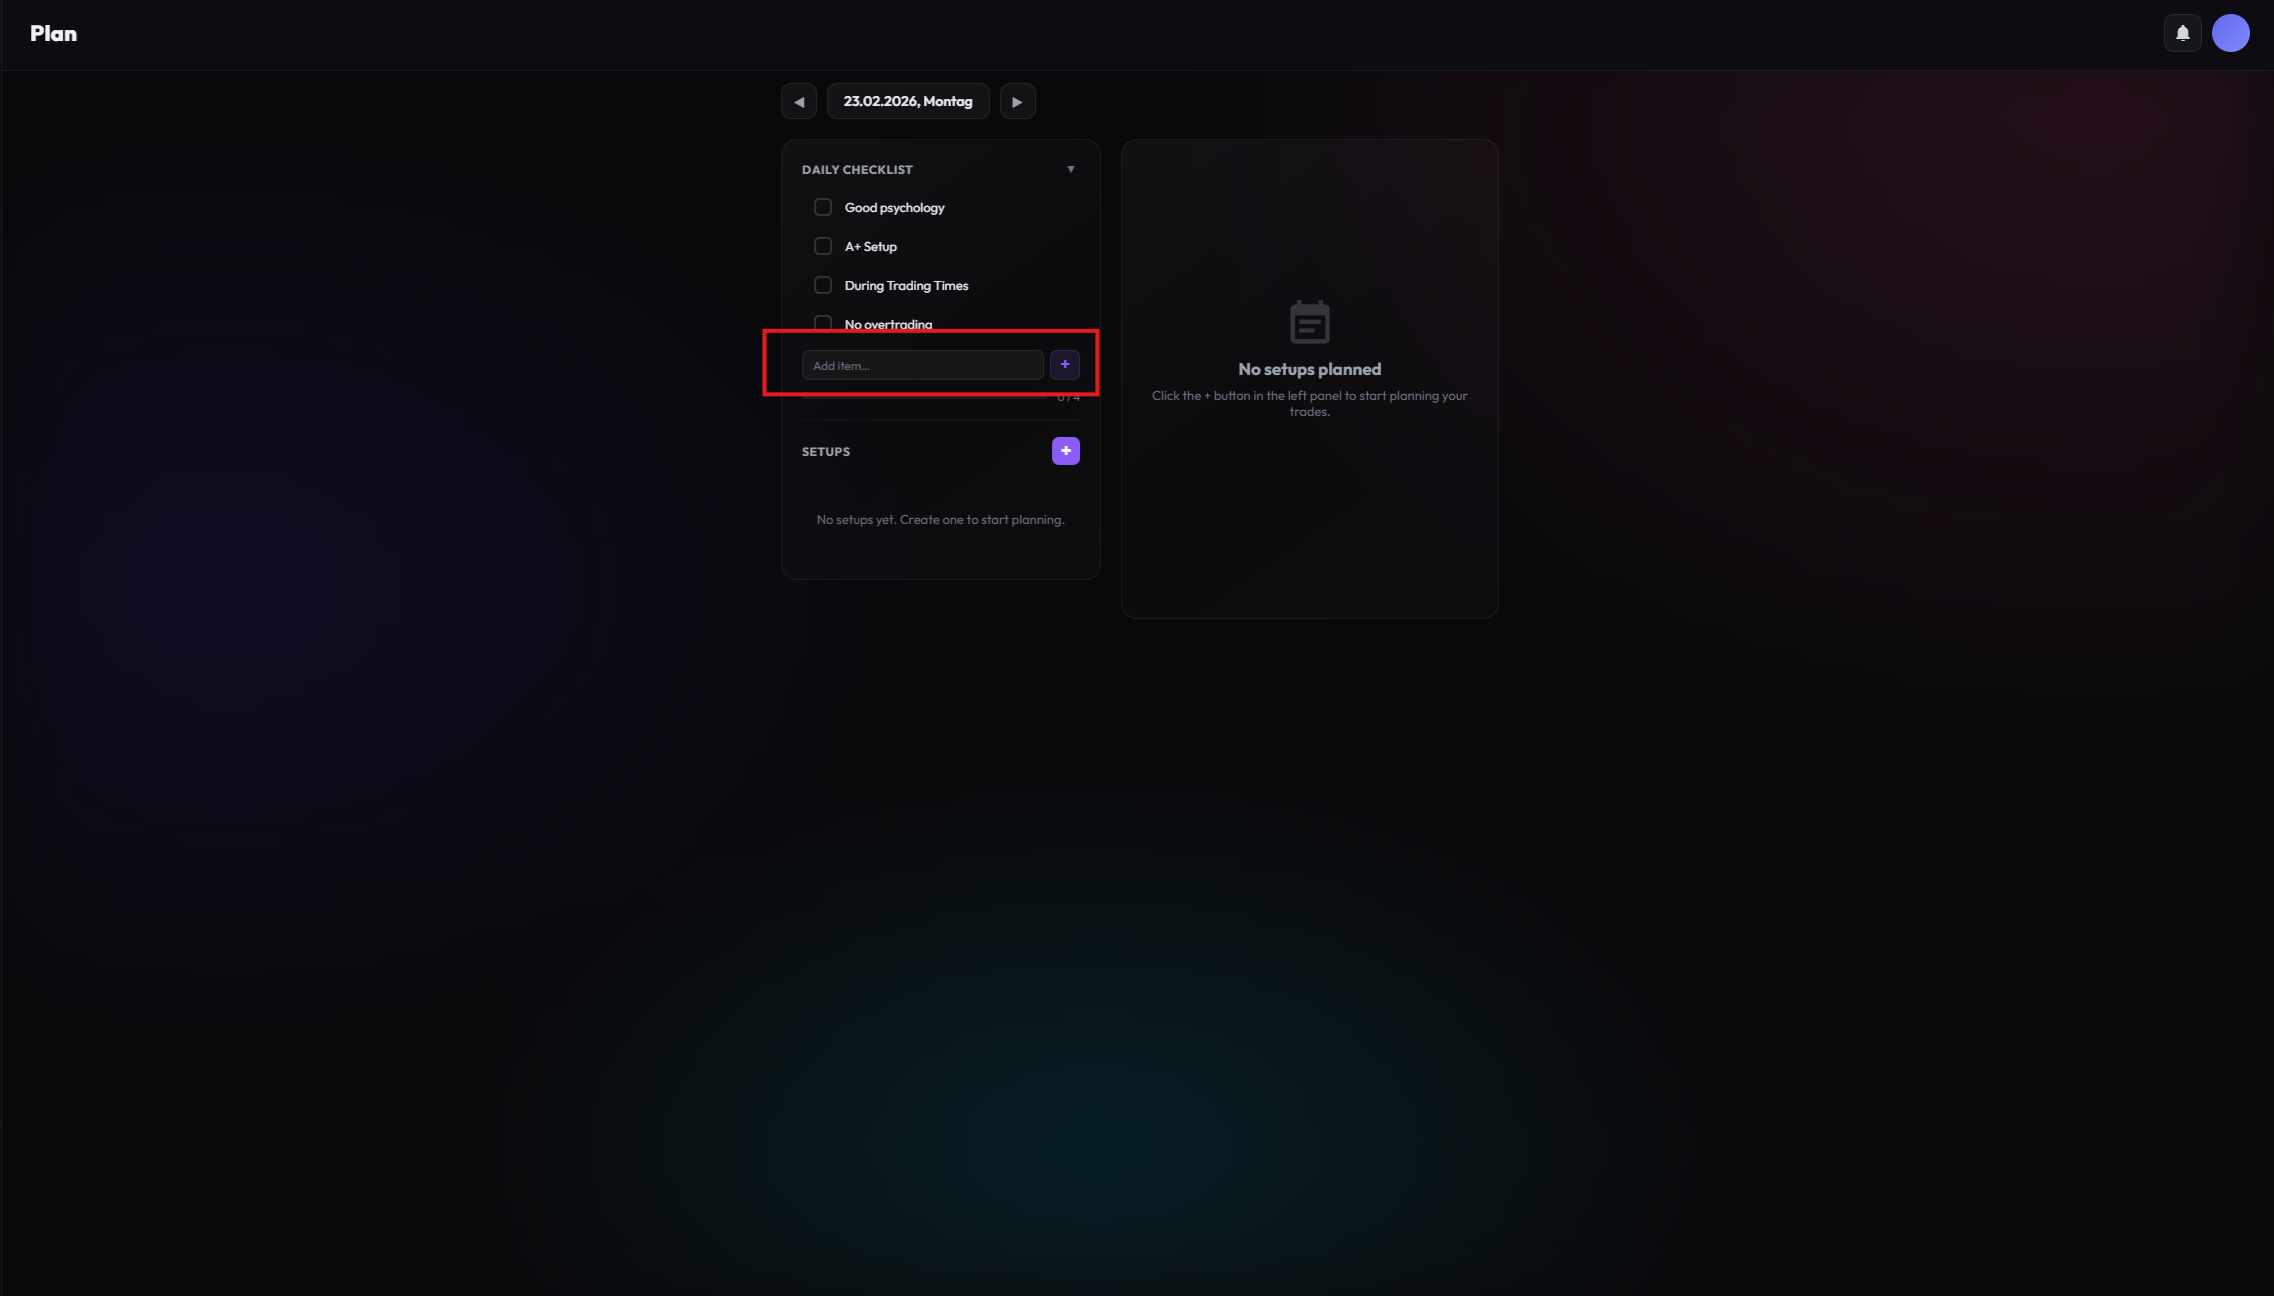
Daily Planning
Start each trading day with intention. Use the daily notes to document market conditions, upcoming news events, and your mental state before entering the market.
- Market Context: Note key support/resistance levels, upcoming economic releases, or overnight developments.
- Mental Check: Rate your readiness. Are you well-rested? Focused? This helps identify patterns between your state and performance.
- Session Goals: Define clear, measurable goals for the day (e.g. "Max 3 trades", "Only A-setups").
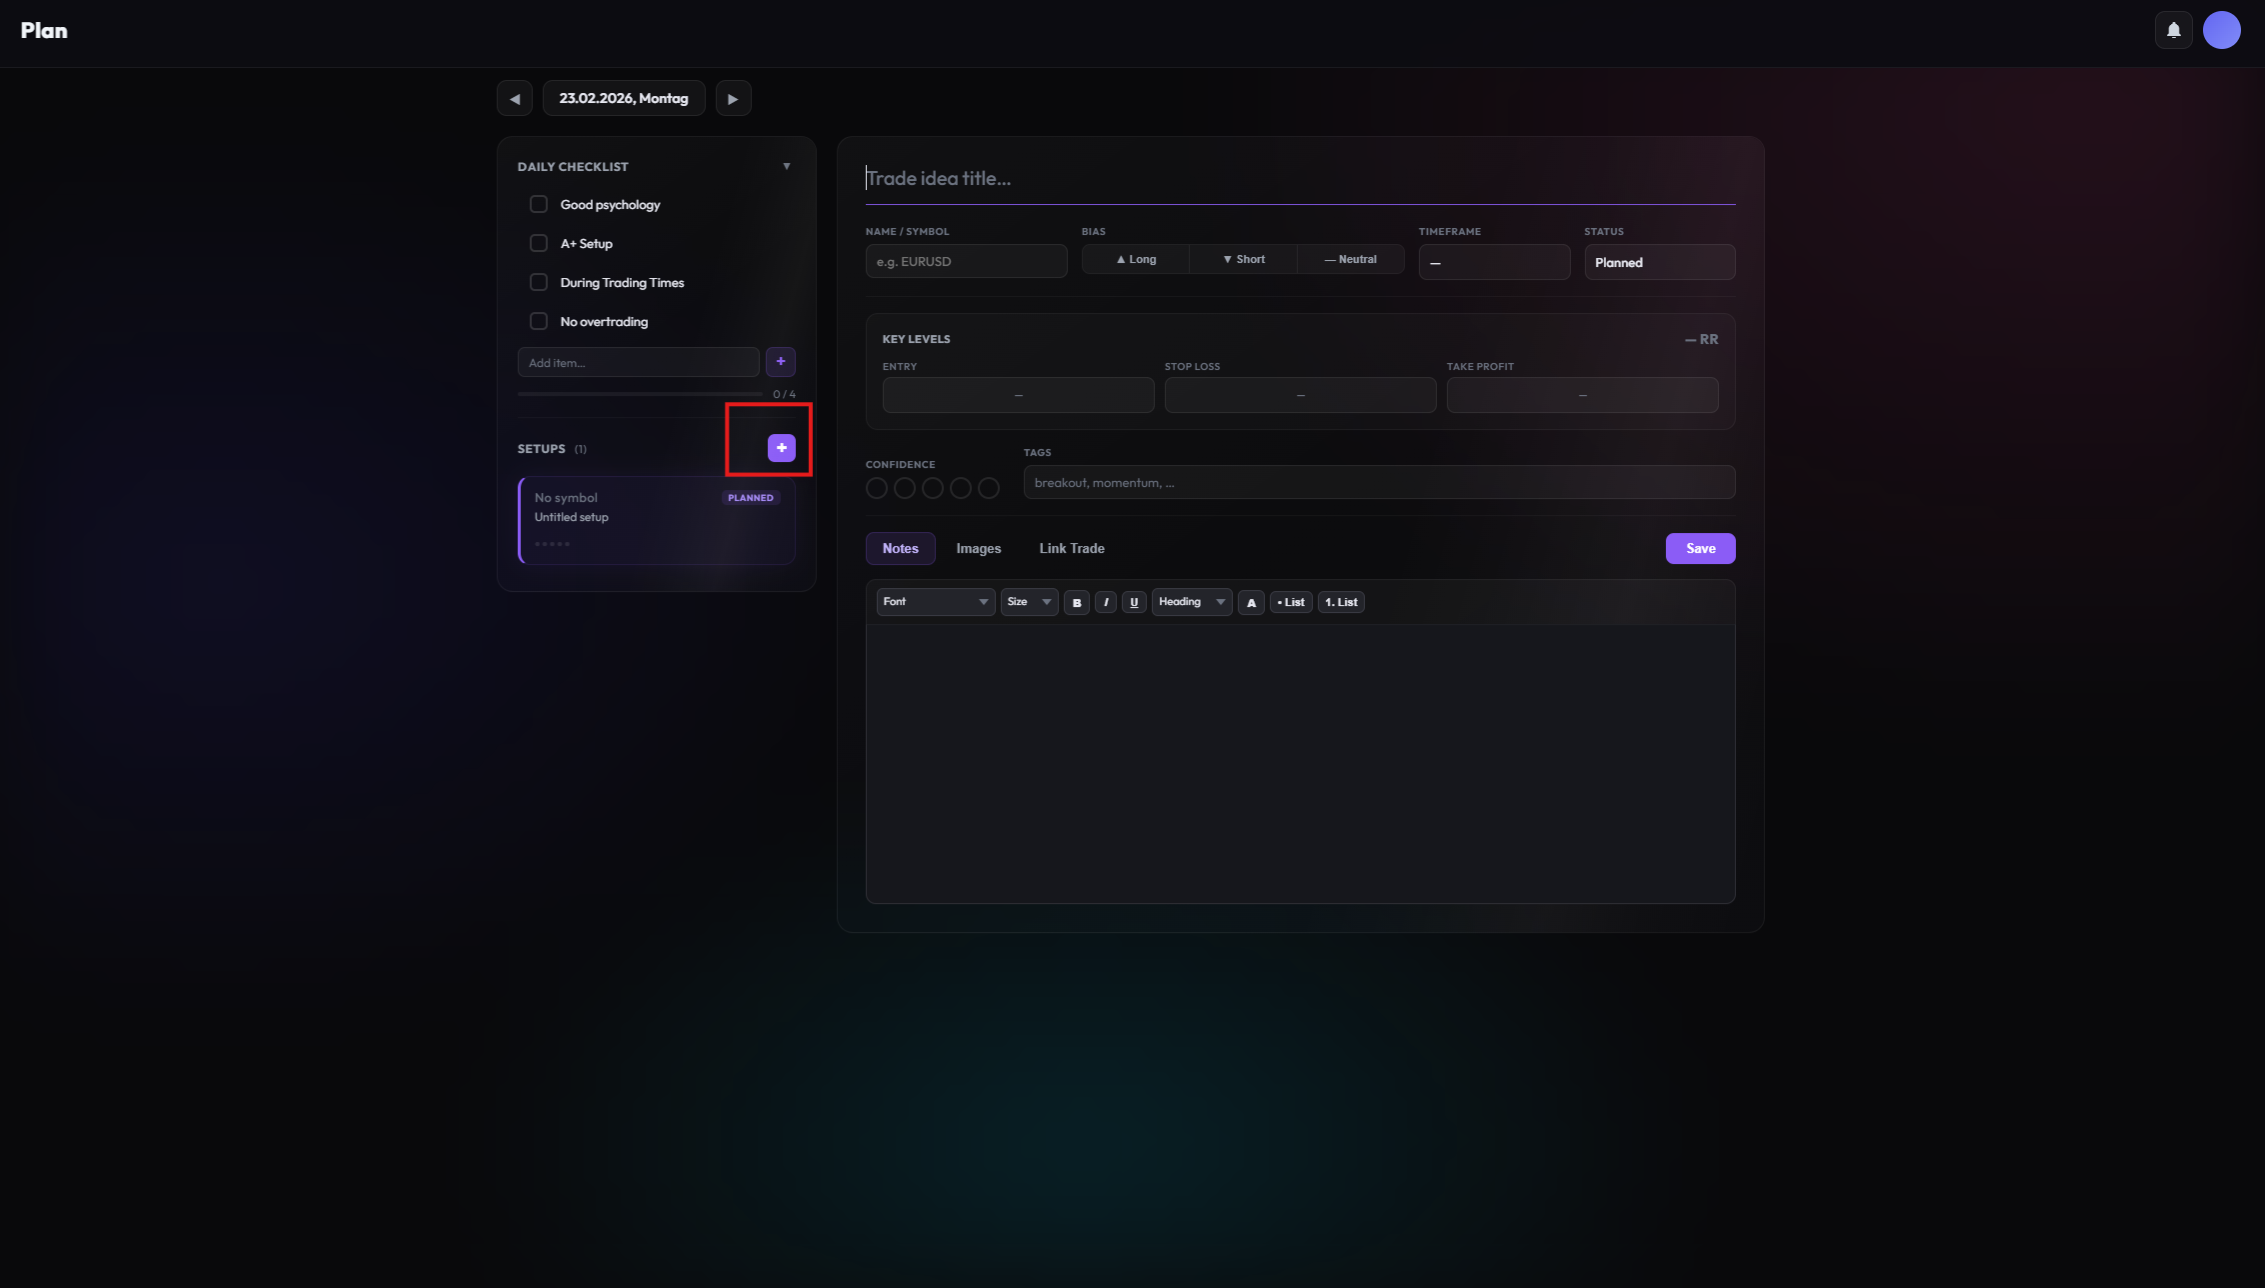
Trade Ideas
Click "New Planned Trade" to sketch out a setup before it triggers. Document the instrument, direction, entry zone, stop loss, and take profit levels. This pre-commitment reduces impulsive decisions.
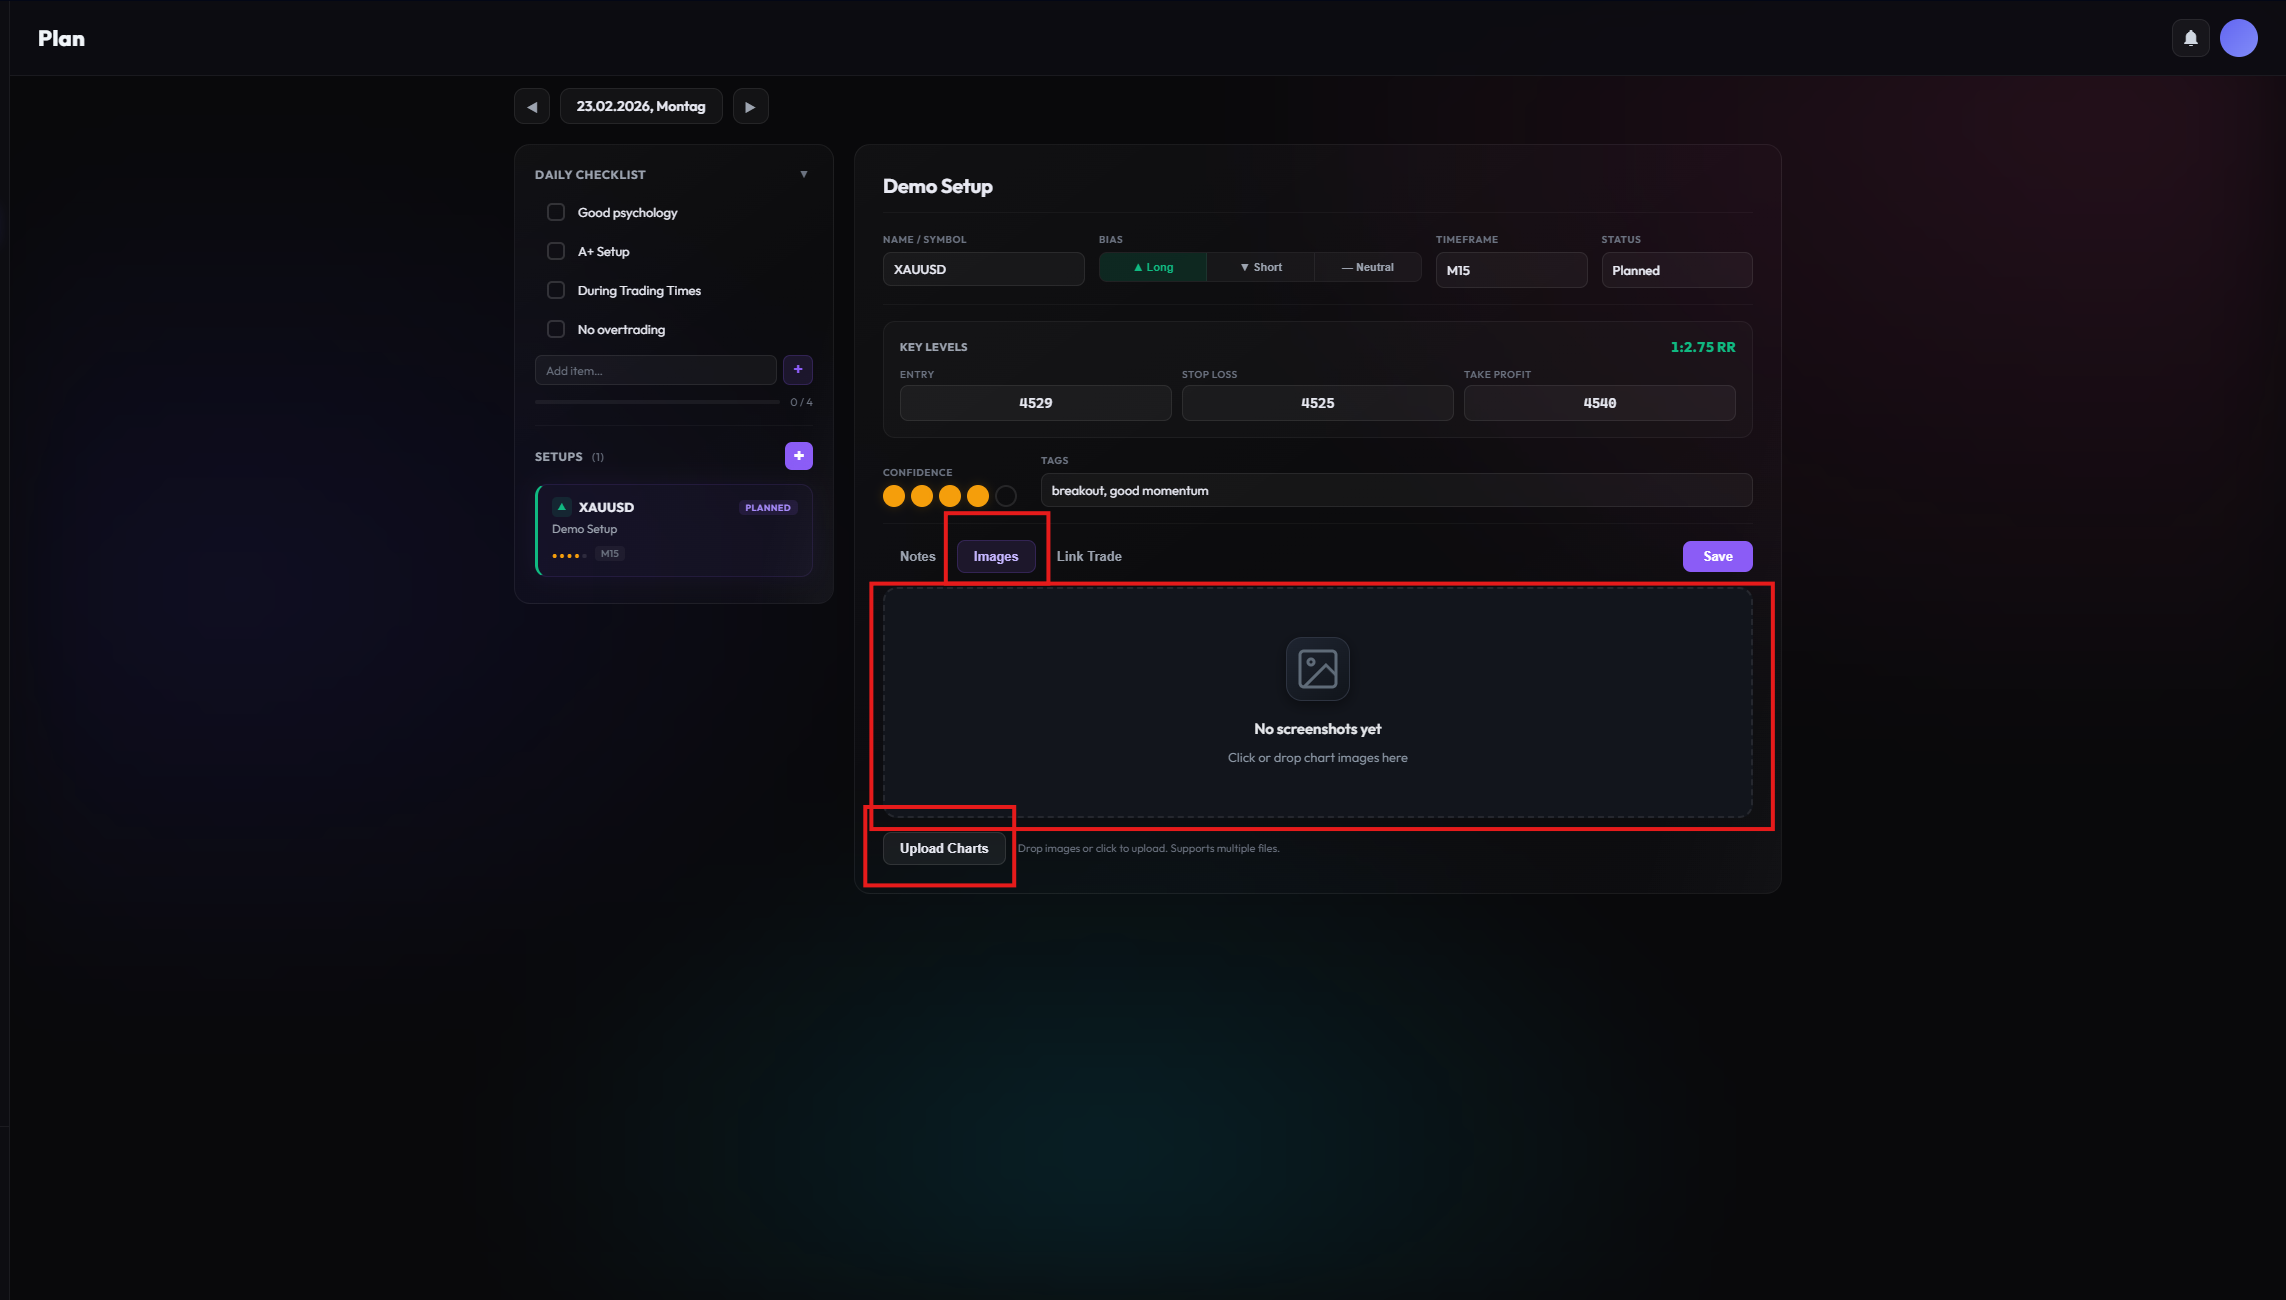
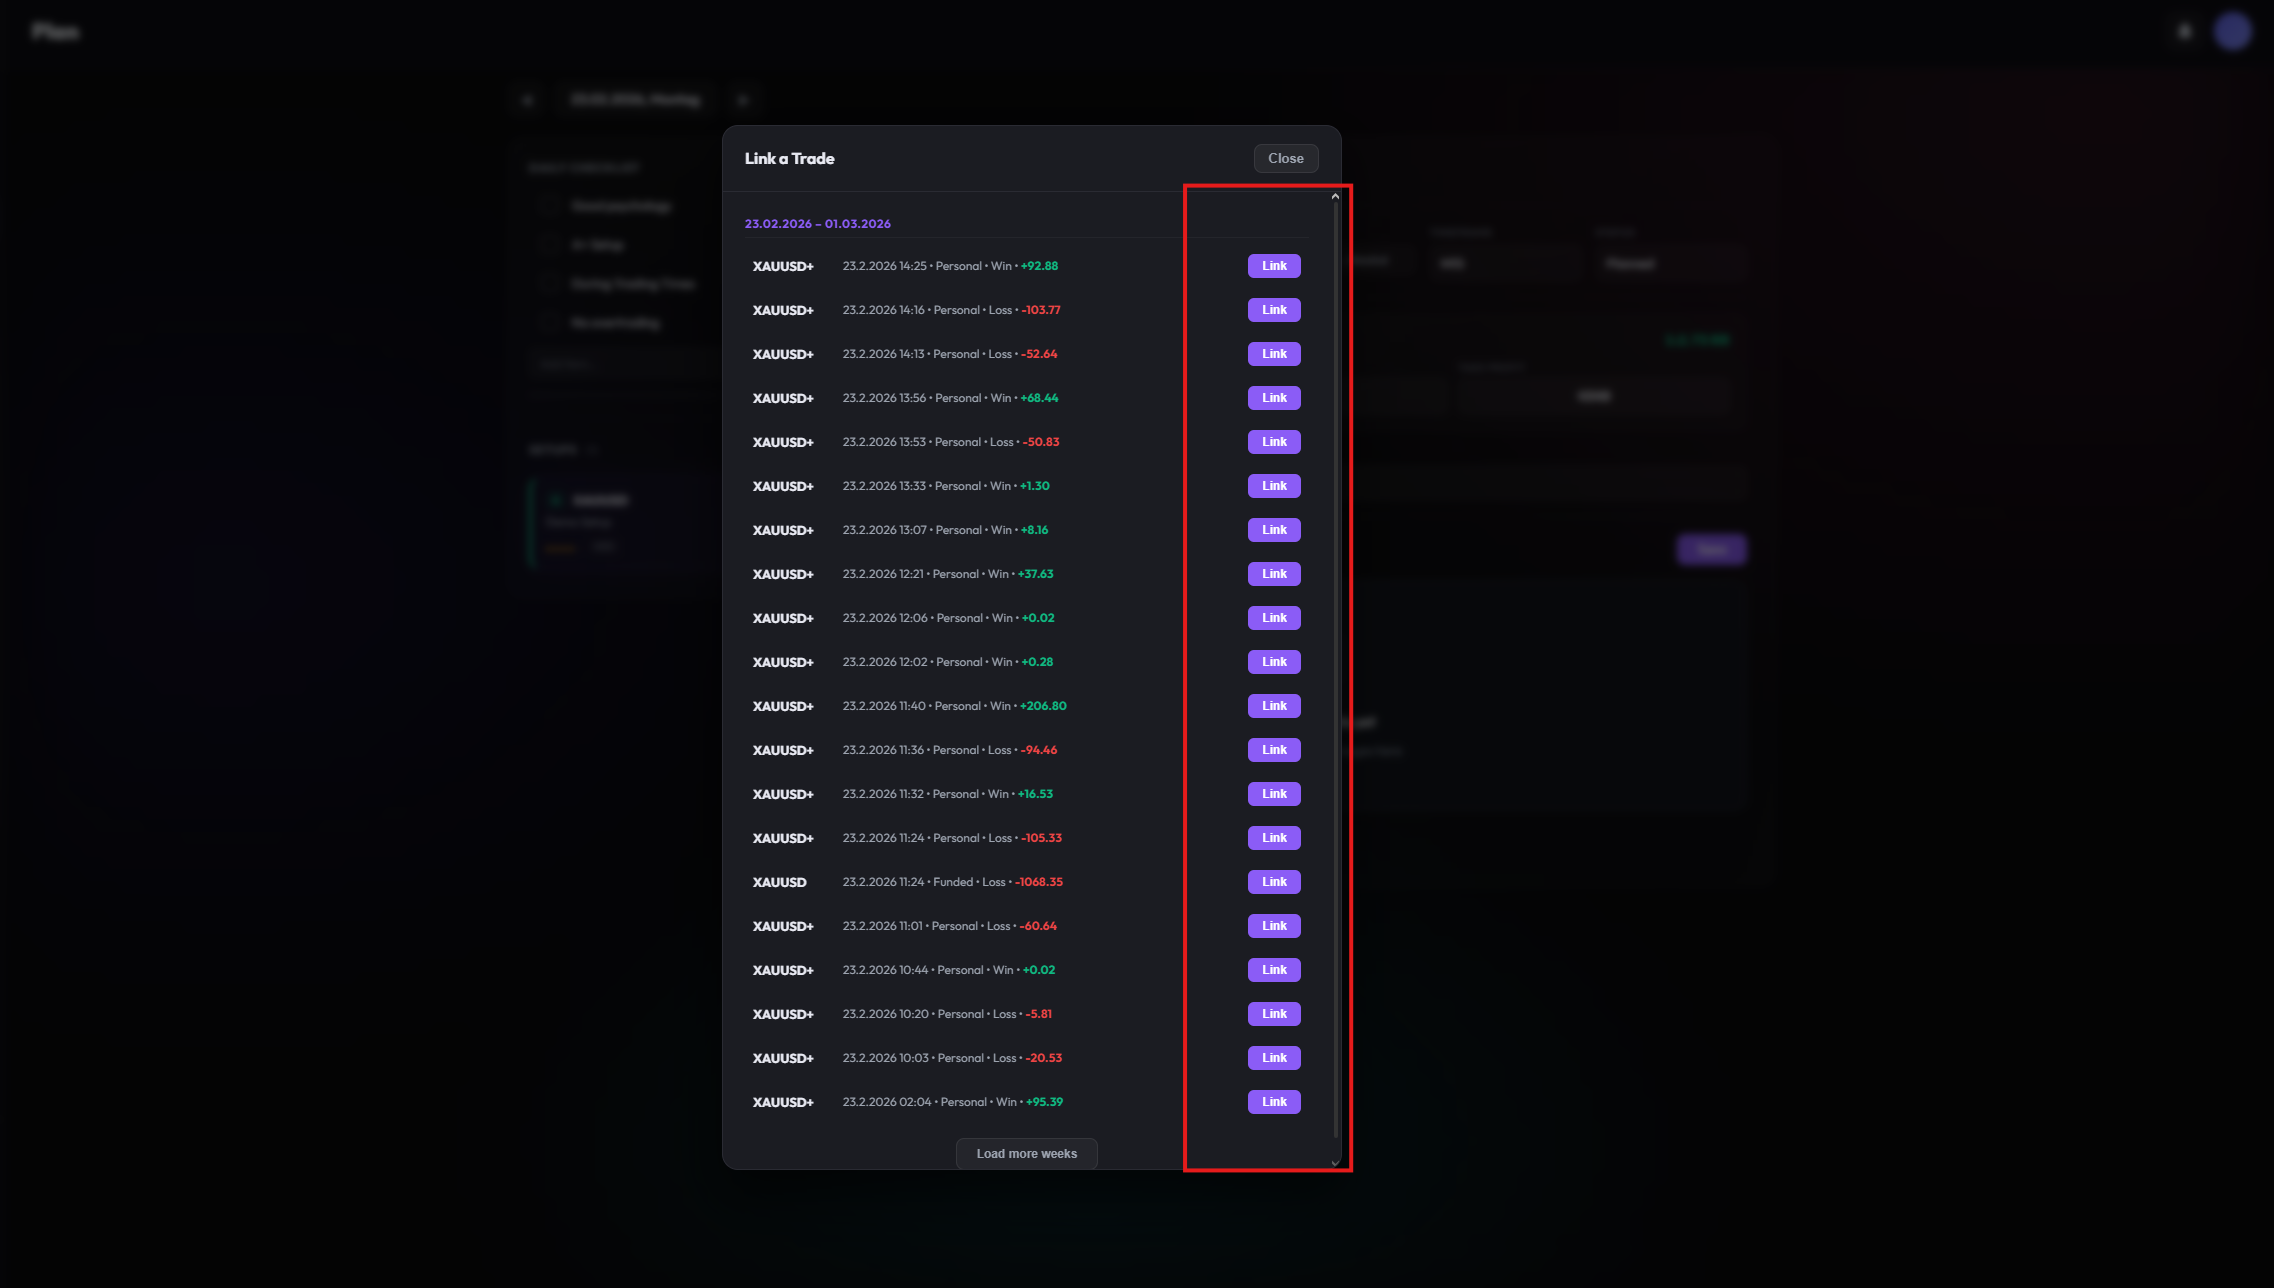
Review & Linking
After a trade is executed, link it back to your original plan. This creates a feedback loop: Did you follow your rules? Was the execution on target? Over time, this builds discipline and reveals where your process breaks down.
Make planning a non-negotiable habit. Traders who plan consistently report significantly better execution discipline. Even 5 minutes of preparation can make the difference between a reactive and a structured trading day.
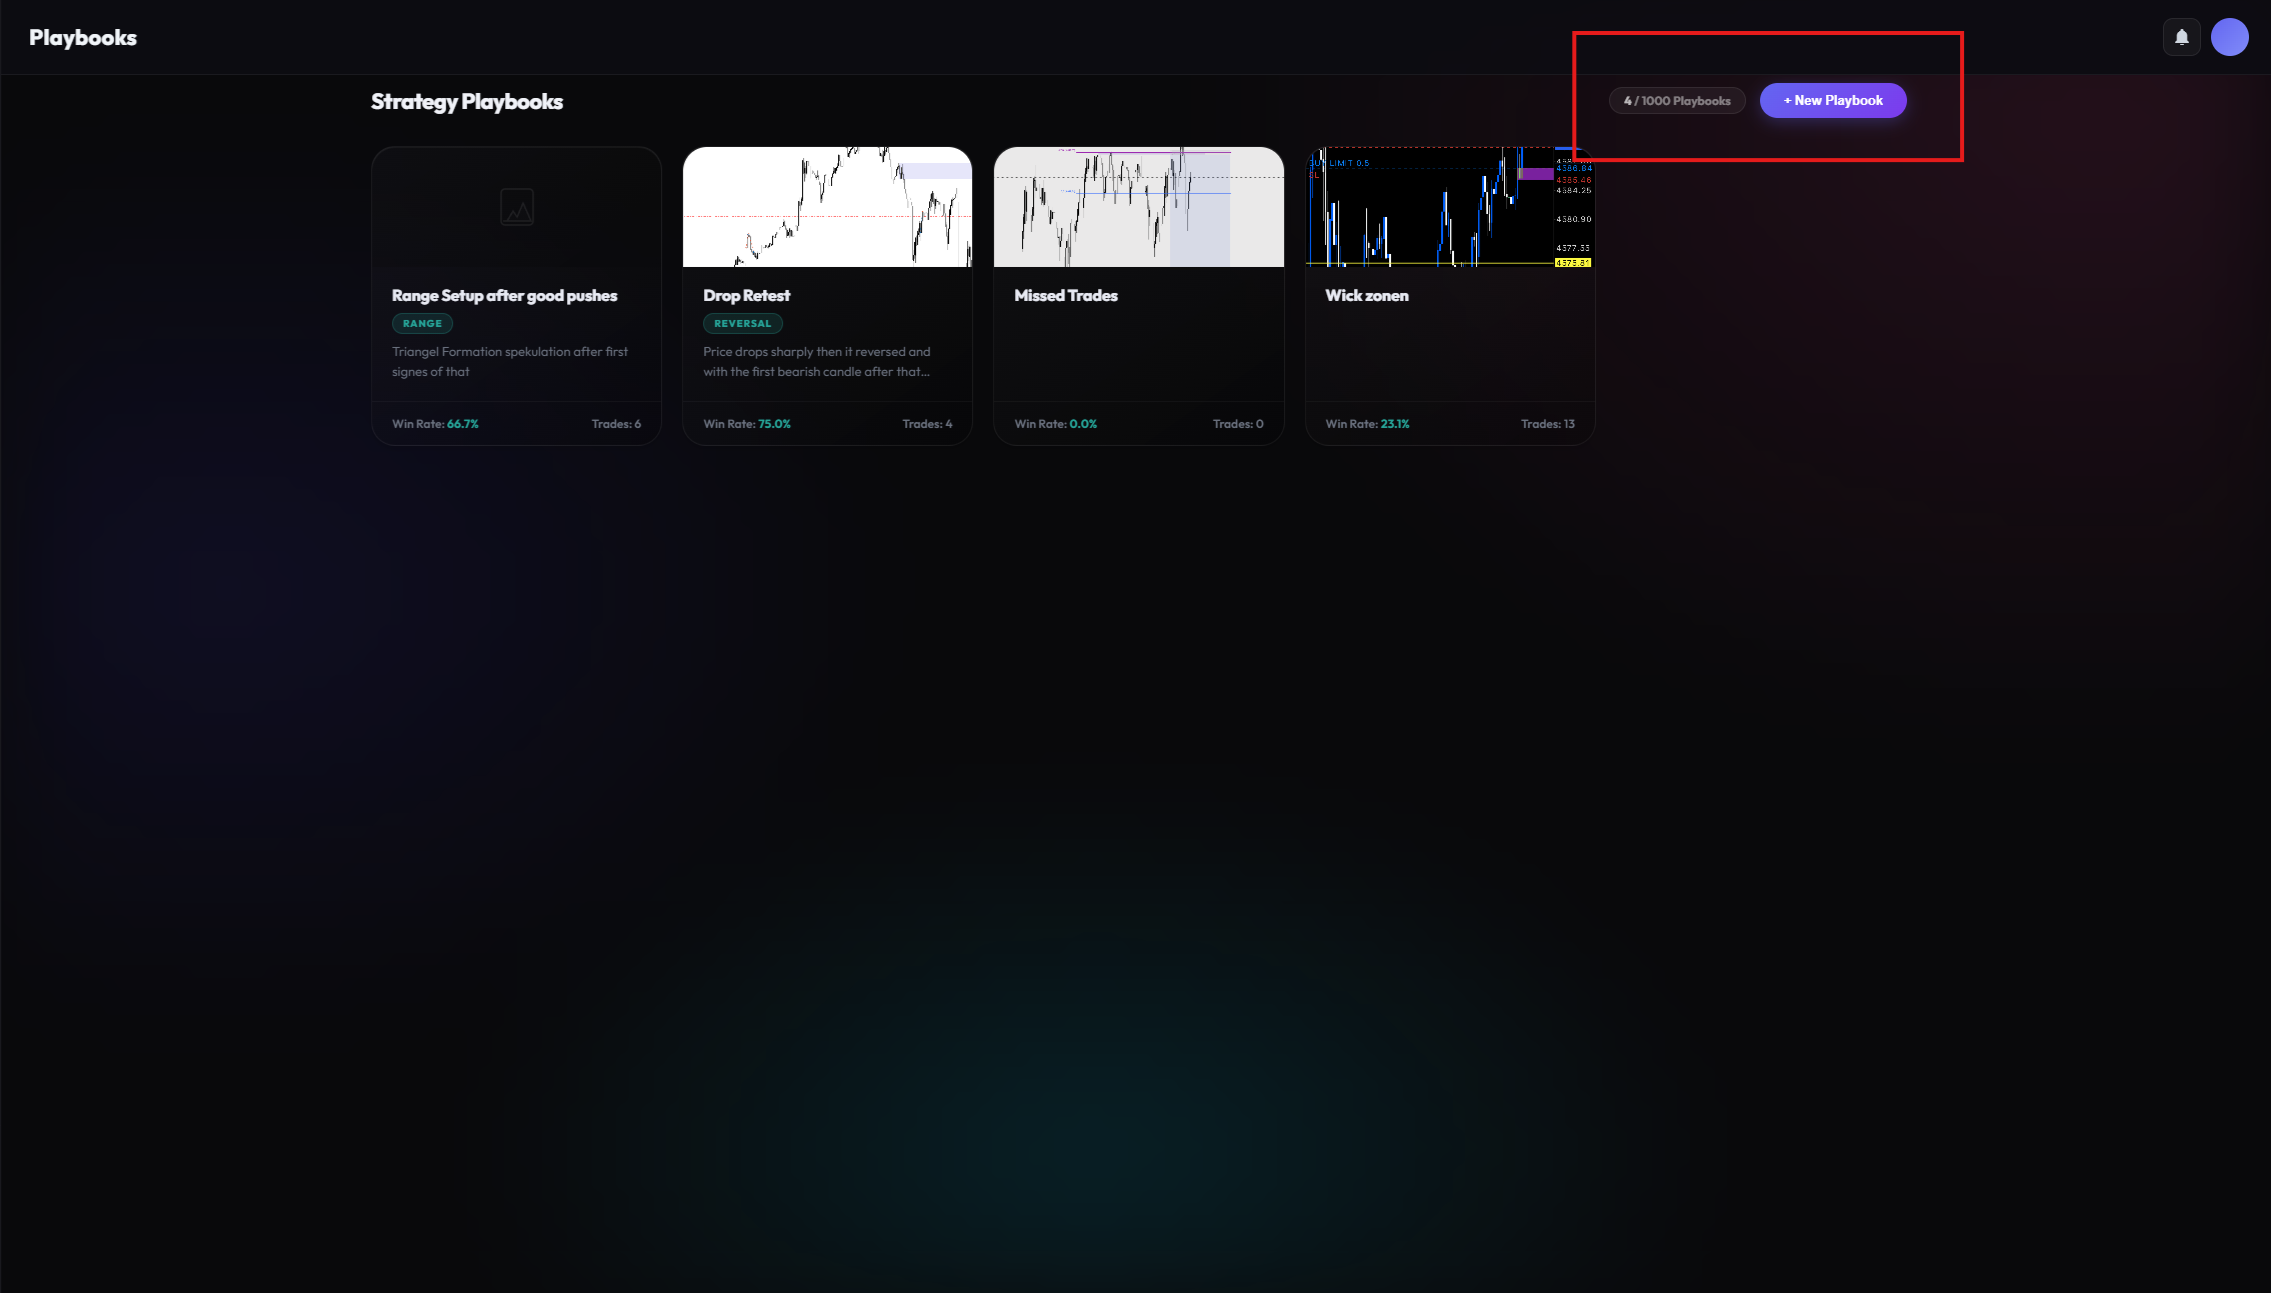
Playbooks
From chance to strategy. Systematize your success by documenting recurring patterns.
A playbook is your collection of best practice examples. Create your own playbook for each of your setups (e.g. "Gold Breakout", "Morning Reversal").
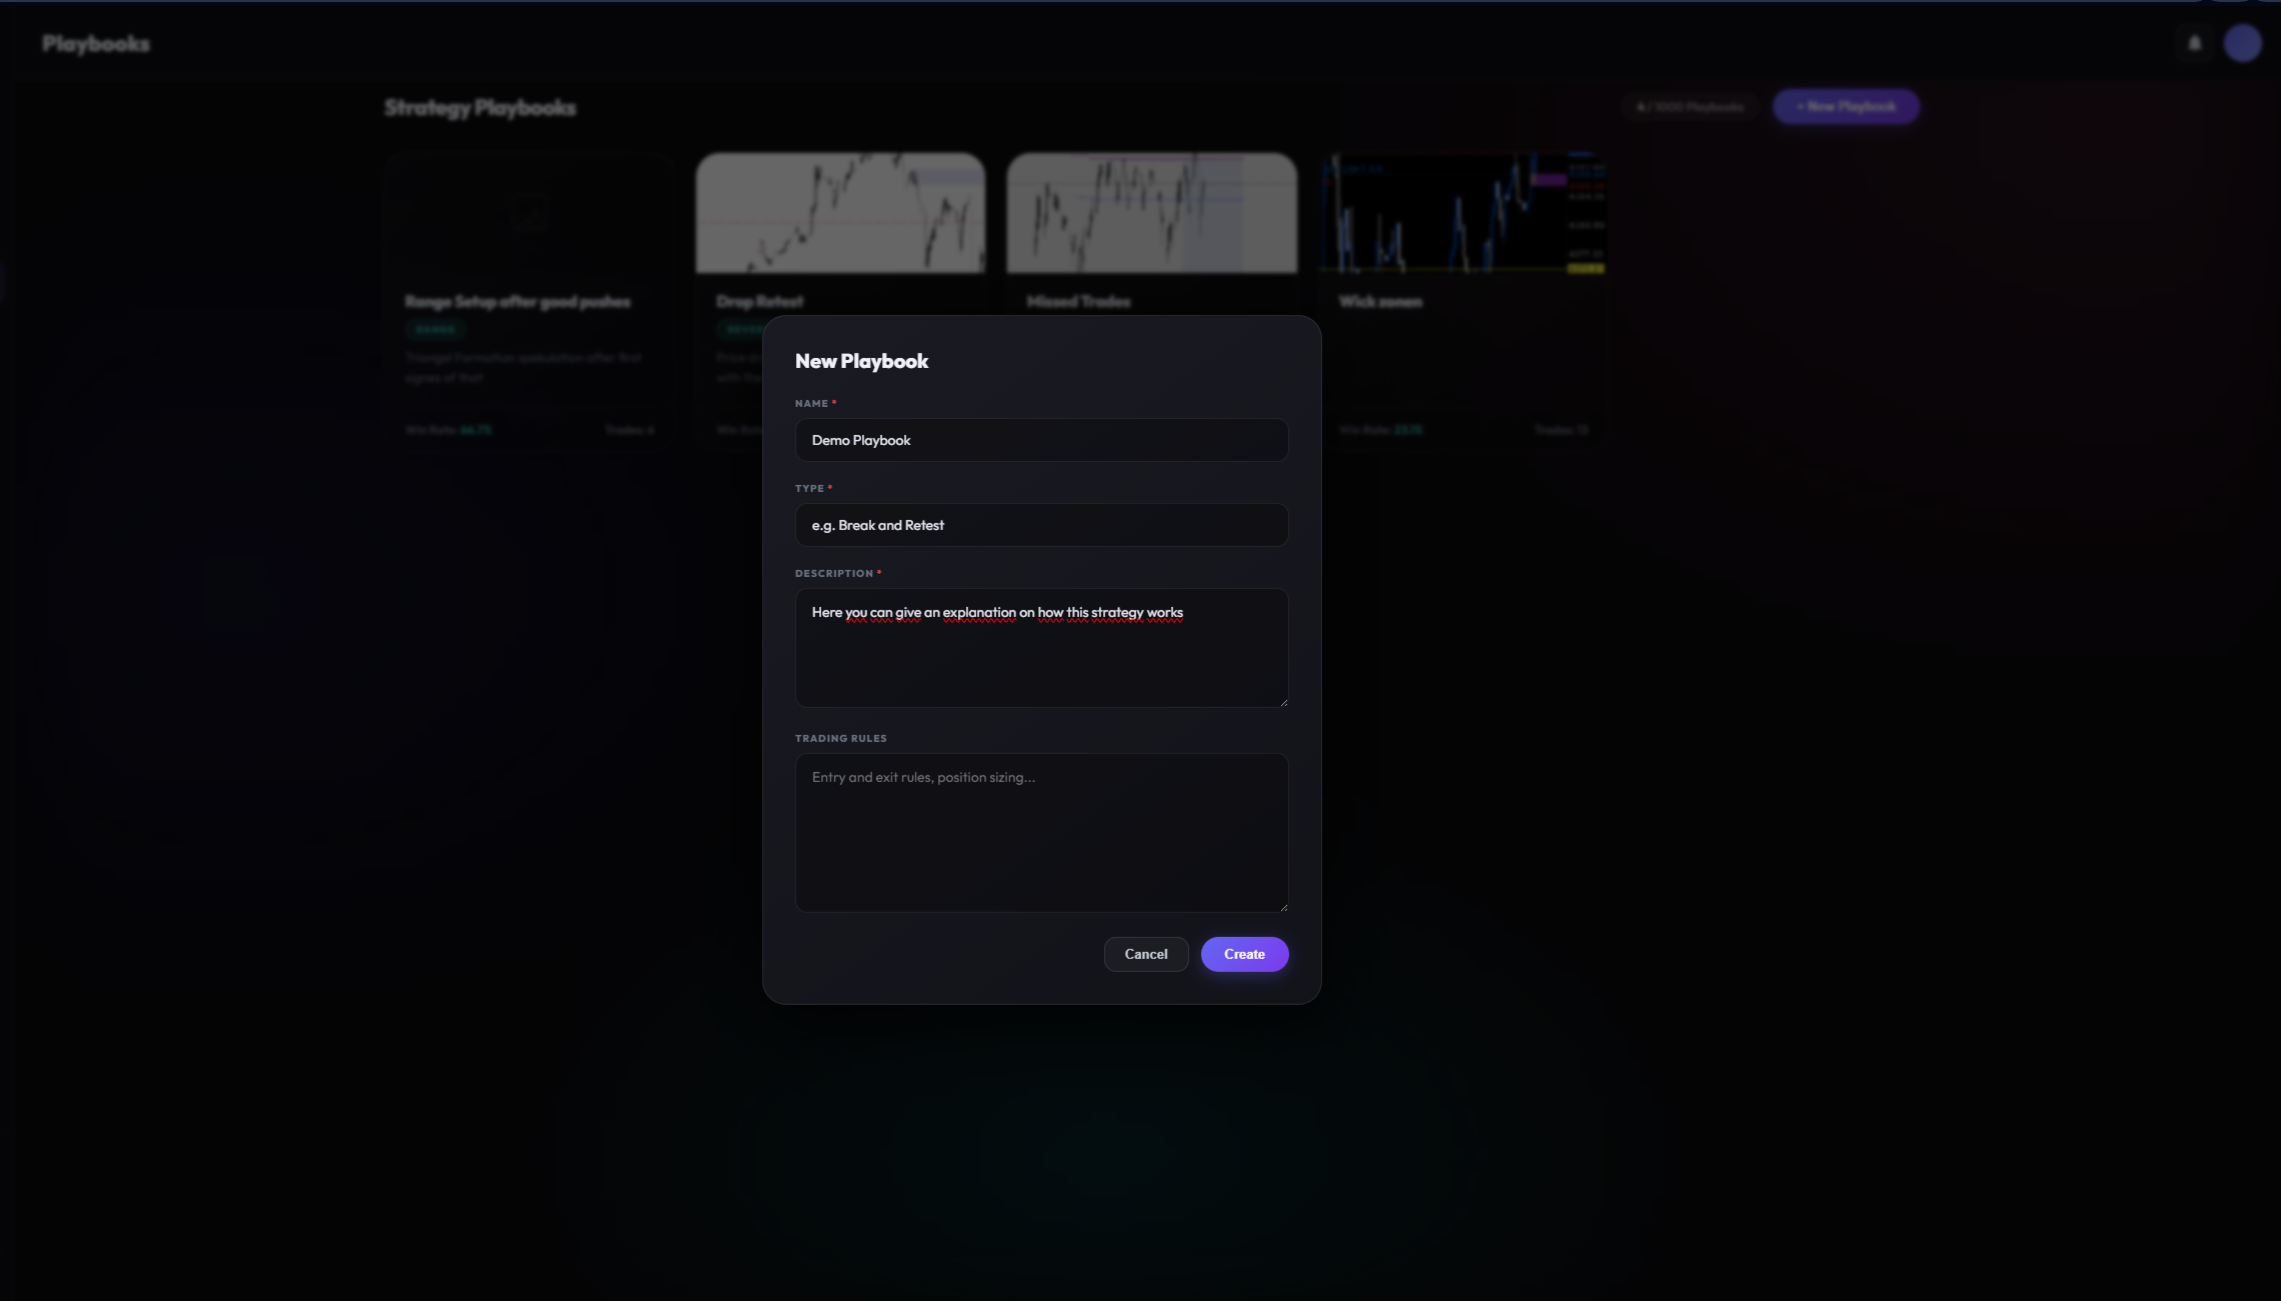
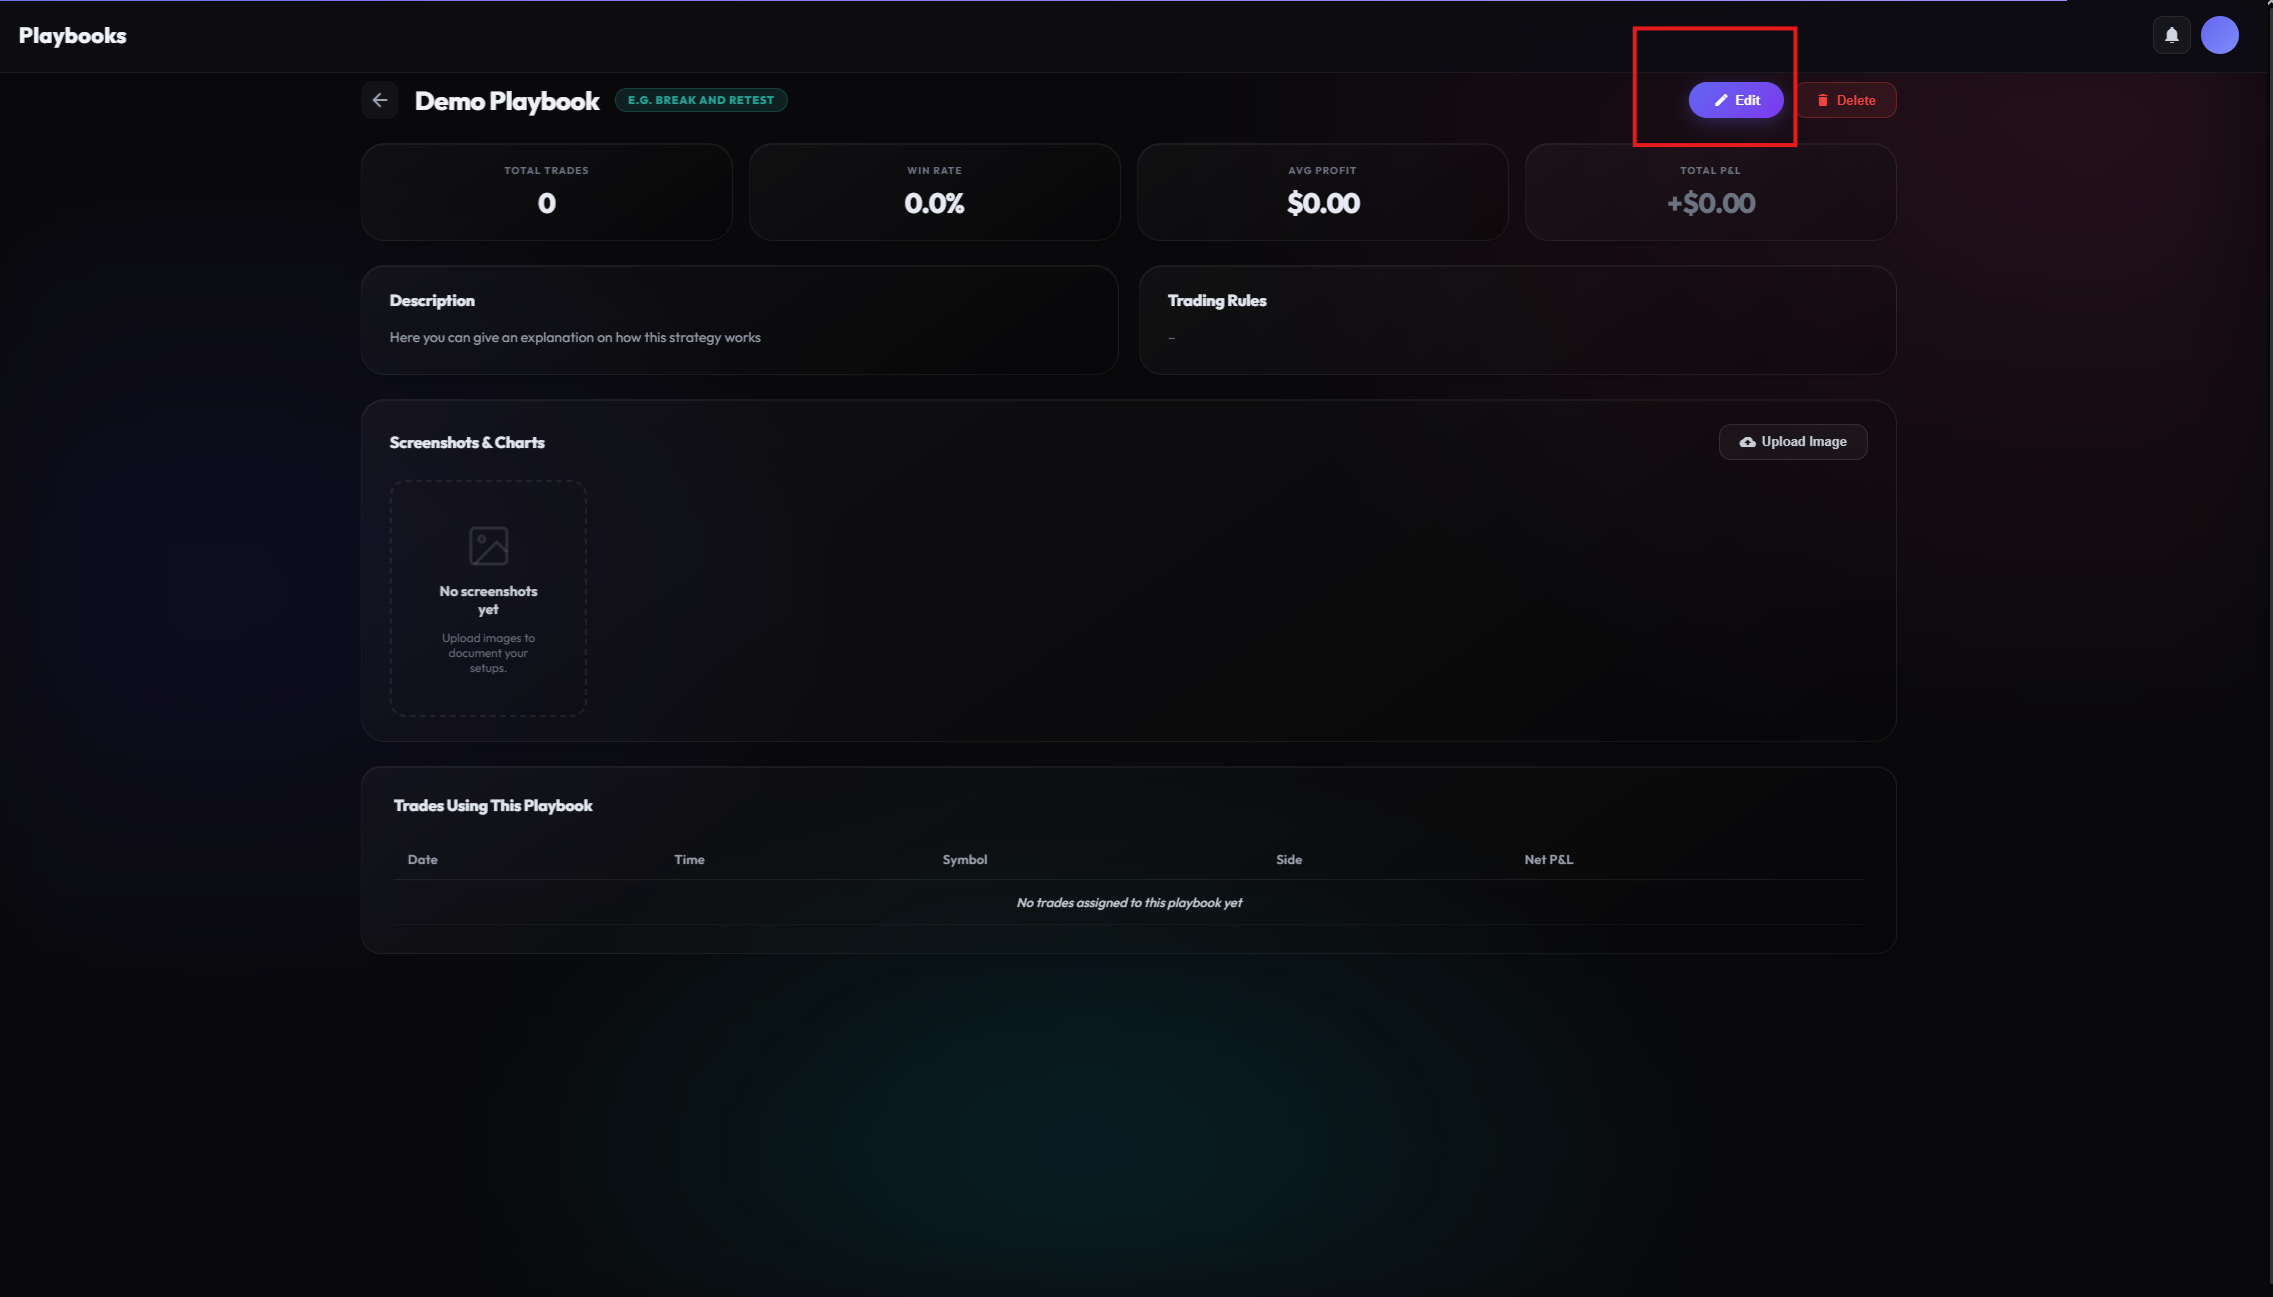
Create a Playbook
Setting up a new playbook takes just a few seconds:
- Name it: Choose a descriptive name that reflects the strategy (e.g. "London Breakout", "FVG Reversal").
- Describe it: Add rules, entry criteria, and conditions so you remember exactly when this setup applies.
- Save it: Your playbook is now ready to receive trades.
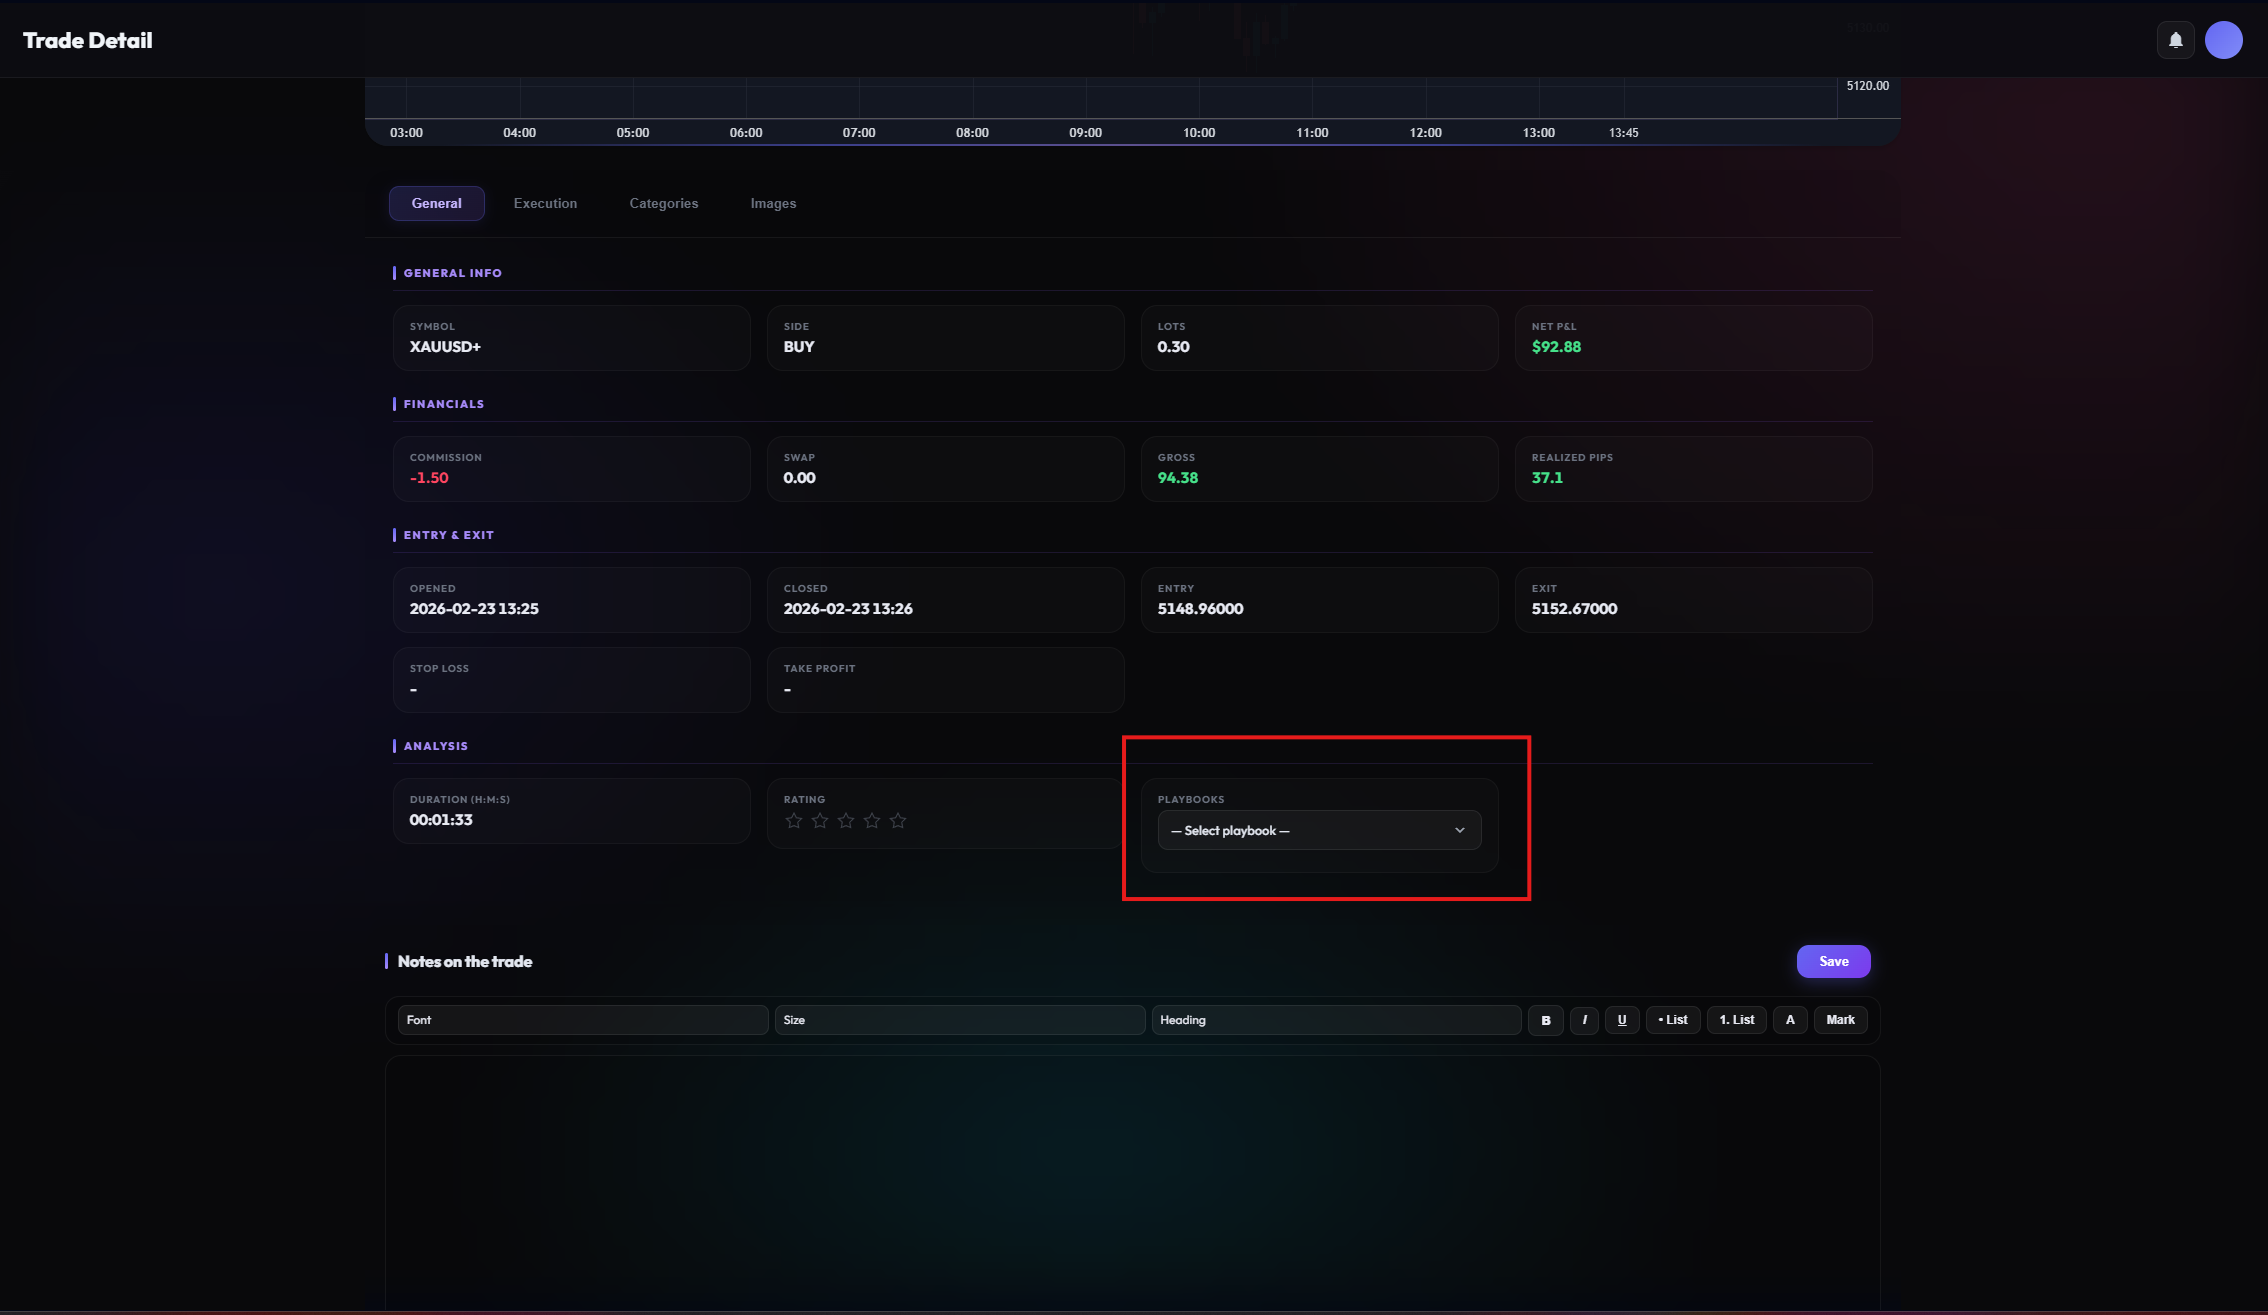
Assign Trades
There are two ways to link trades to a playbook: Open a trade's detail view and select the playbook from the dropdown, or use the bulk assignment in the "All Trades" list by selecting multiple trades and choosing a playbook.
Analyze Performance
In the "Trades" tab of each playbook, you see all assigned trades with their combined statistics. This reveals which strategies are actually profitable and which need refinement. Compare win rates, average RRR, and profit factor across different playbooks to focus on what works.
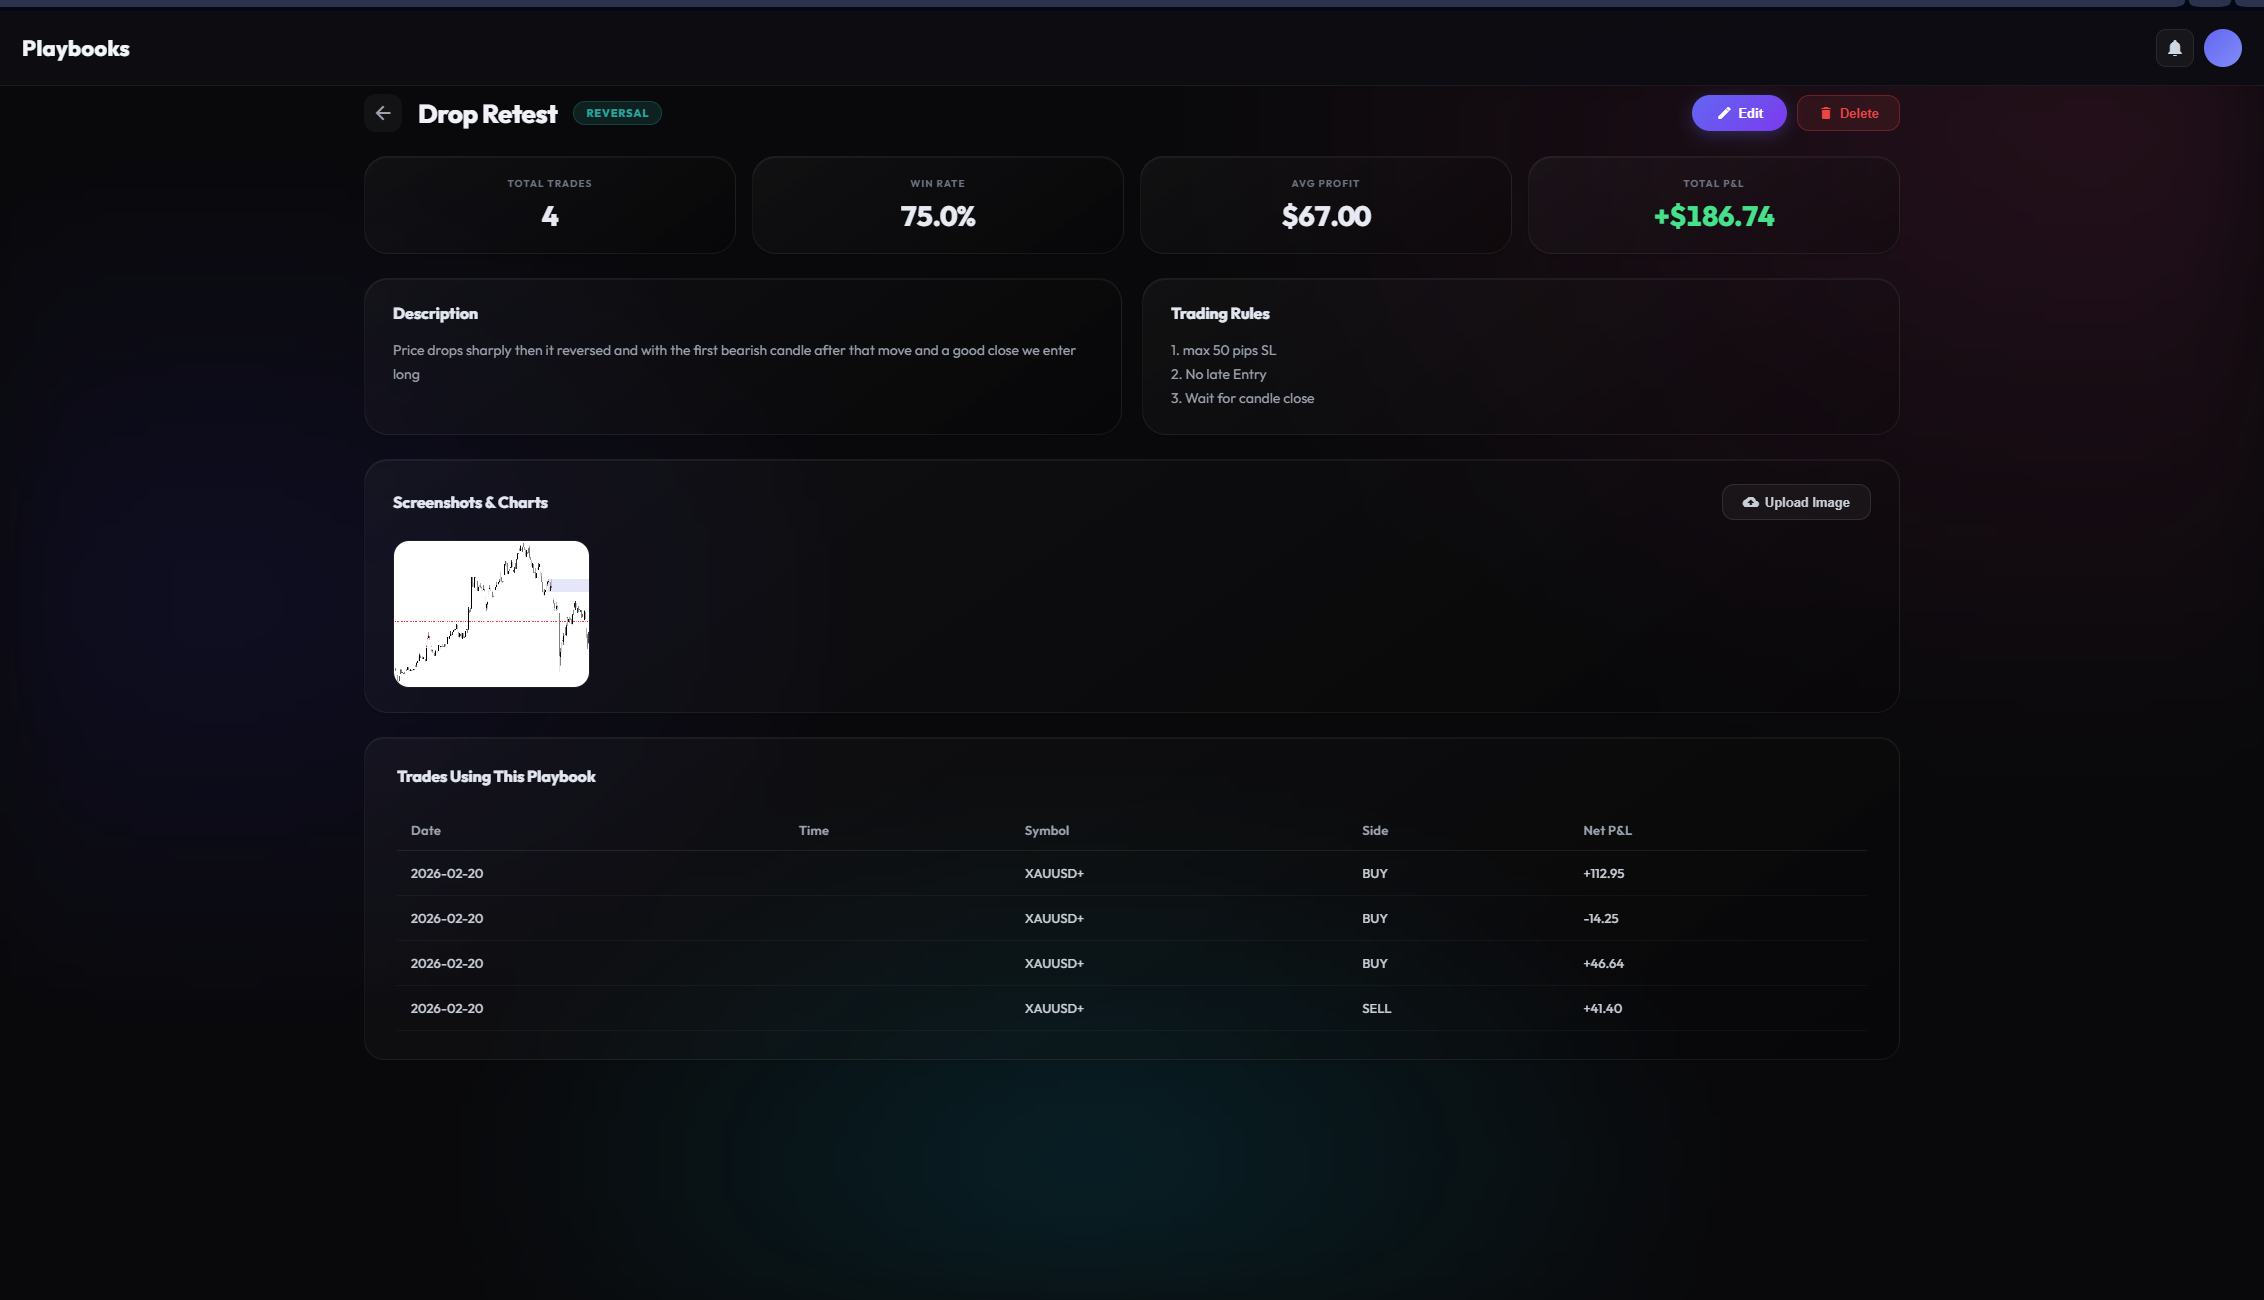
Start with 2-3 core playbooks rather than creating too many. Quality over quantity: a well-documented playbook with 50+ trades gives you statistically meaningful data to make real improvements.
Mentor Mode
Trading doesn't have to be a lonely path. Mentor Mode allows you to securely share your data with coaches or partners.
Transparency promotes growth. Invite a mentor to receive feedback on your trades, or supervise students yourself.
Invite a Mentor
Want feedback from an experienced trader or coach? The invitation process is straightforward:
- Navigate: Go to the Mentor section in your dashboard.
- Send Invite: Enter your mentor's email address or share a unique invitation link.
- Confirm Access: Once the mentor accepts, they can view your trading data in read-only mode.
Work as a Mentor
If you are a coach or experienced trader, you can accept student invitations to review their performance. Switch between your own dashboard and your students' views seamlessly. Analyze their trades, identify weaknesses, and provide targeted feedback.
Manage Access
You stay in full control at all times. Revoke access with a single click if you no longer want to share your data. All connections can be managed from the Mentor settings page.
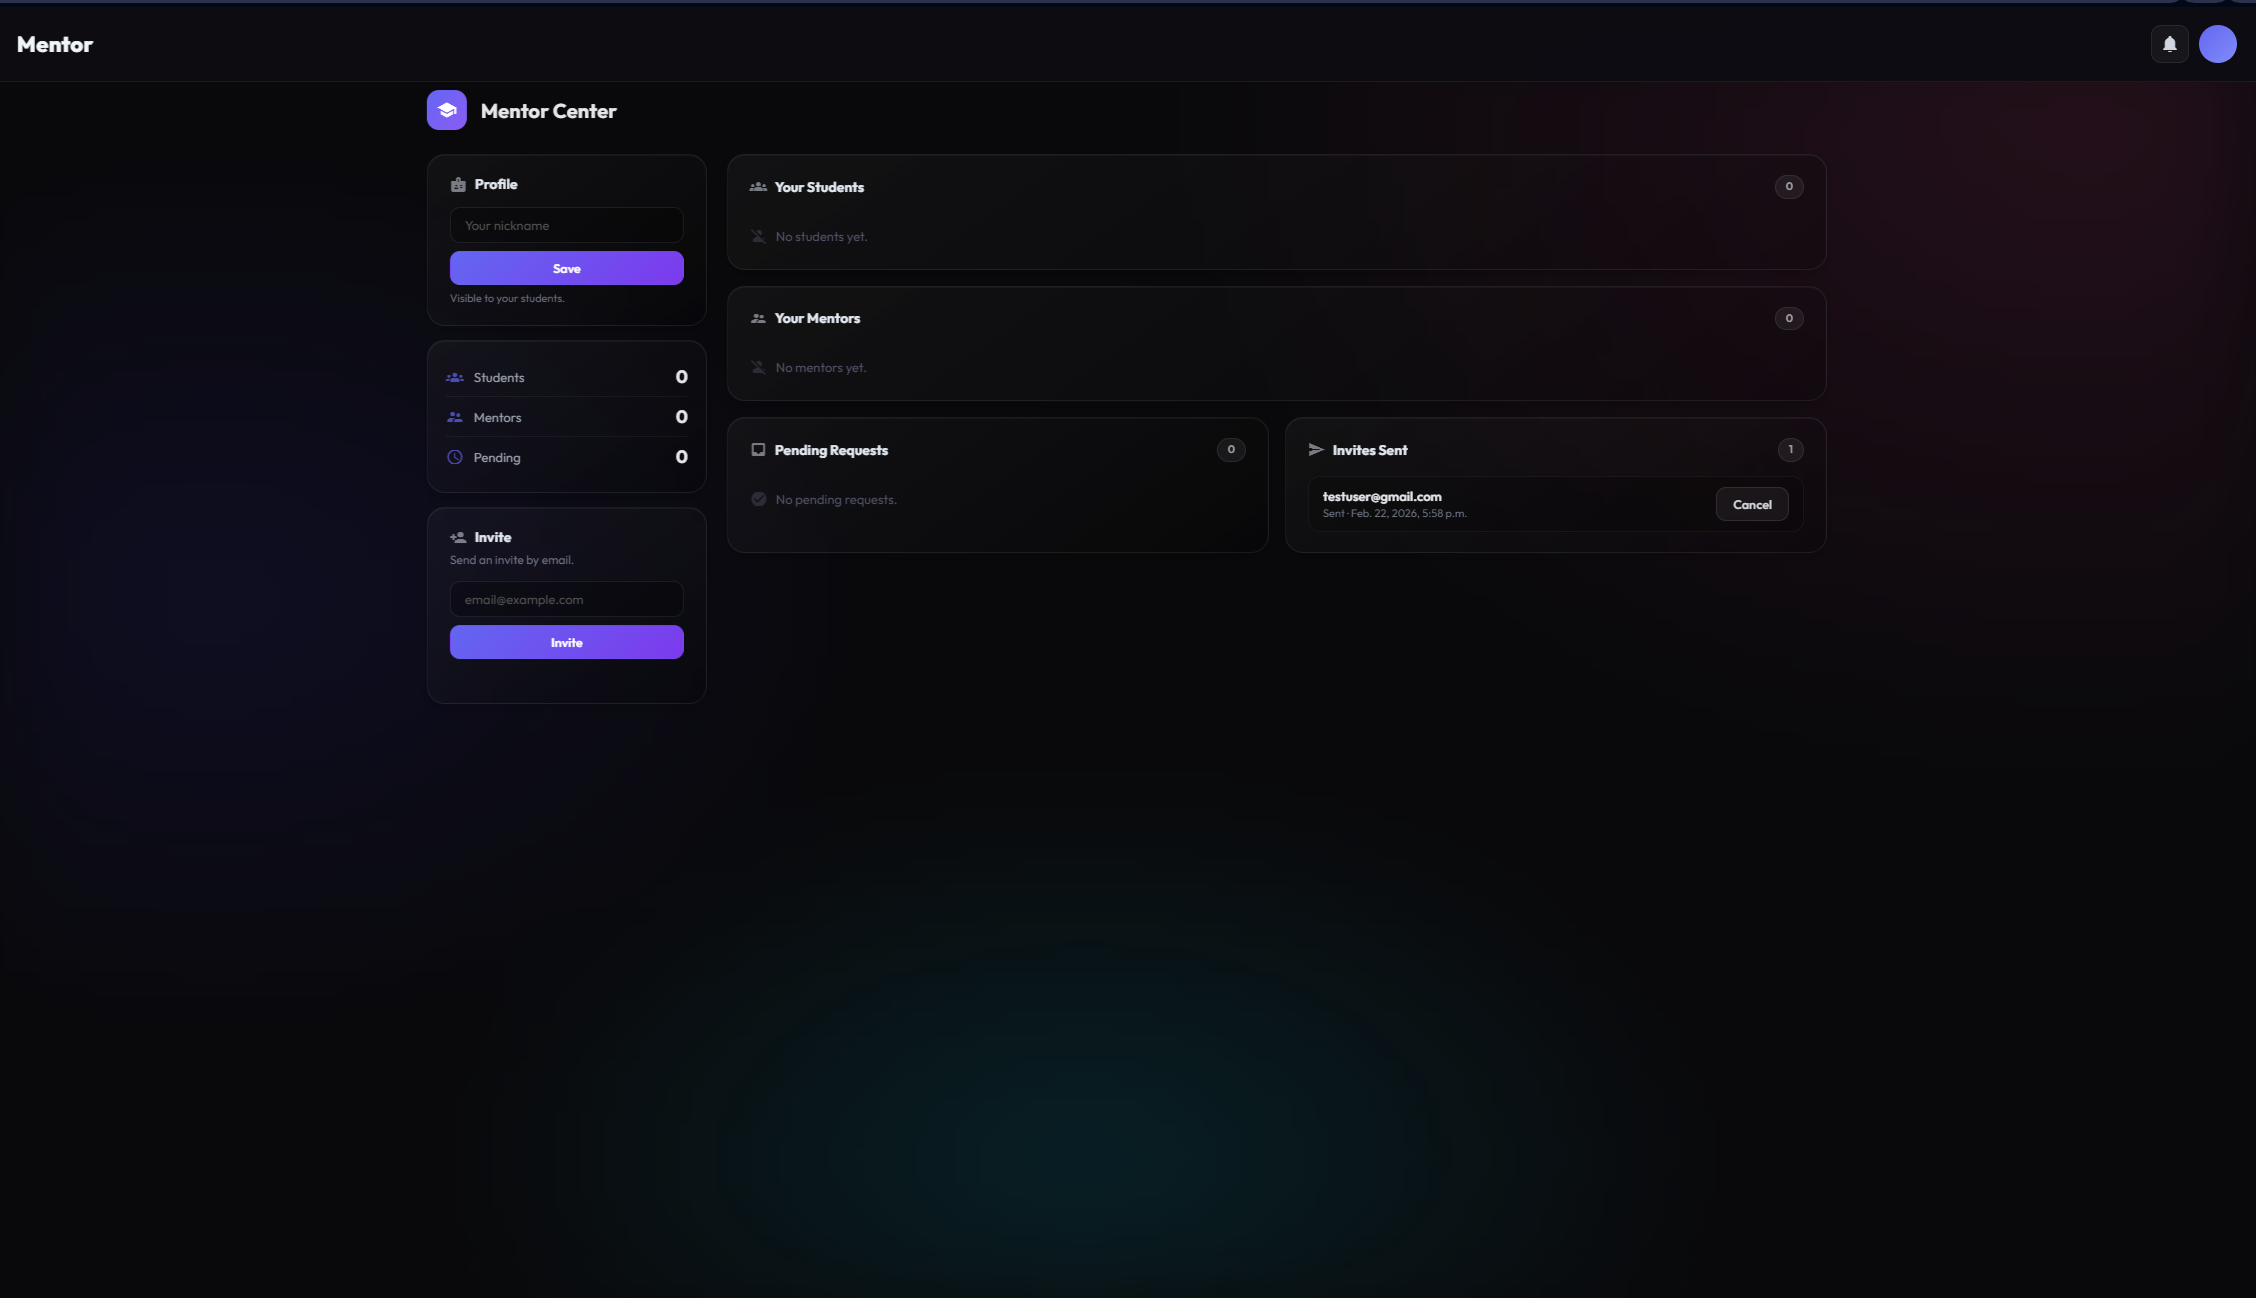
Set a nickname to protect your identity (email). You always retain full control over who has access to your data.
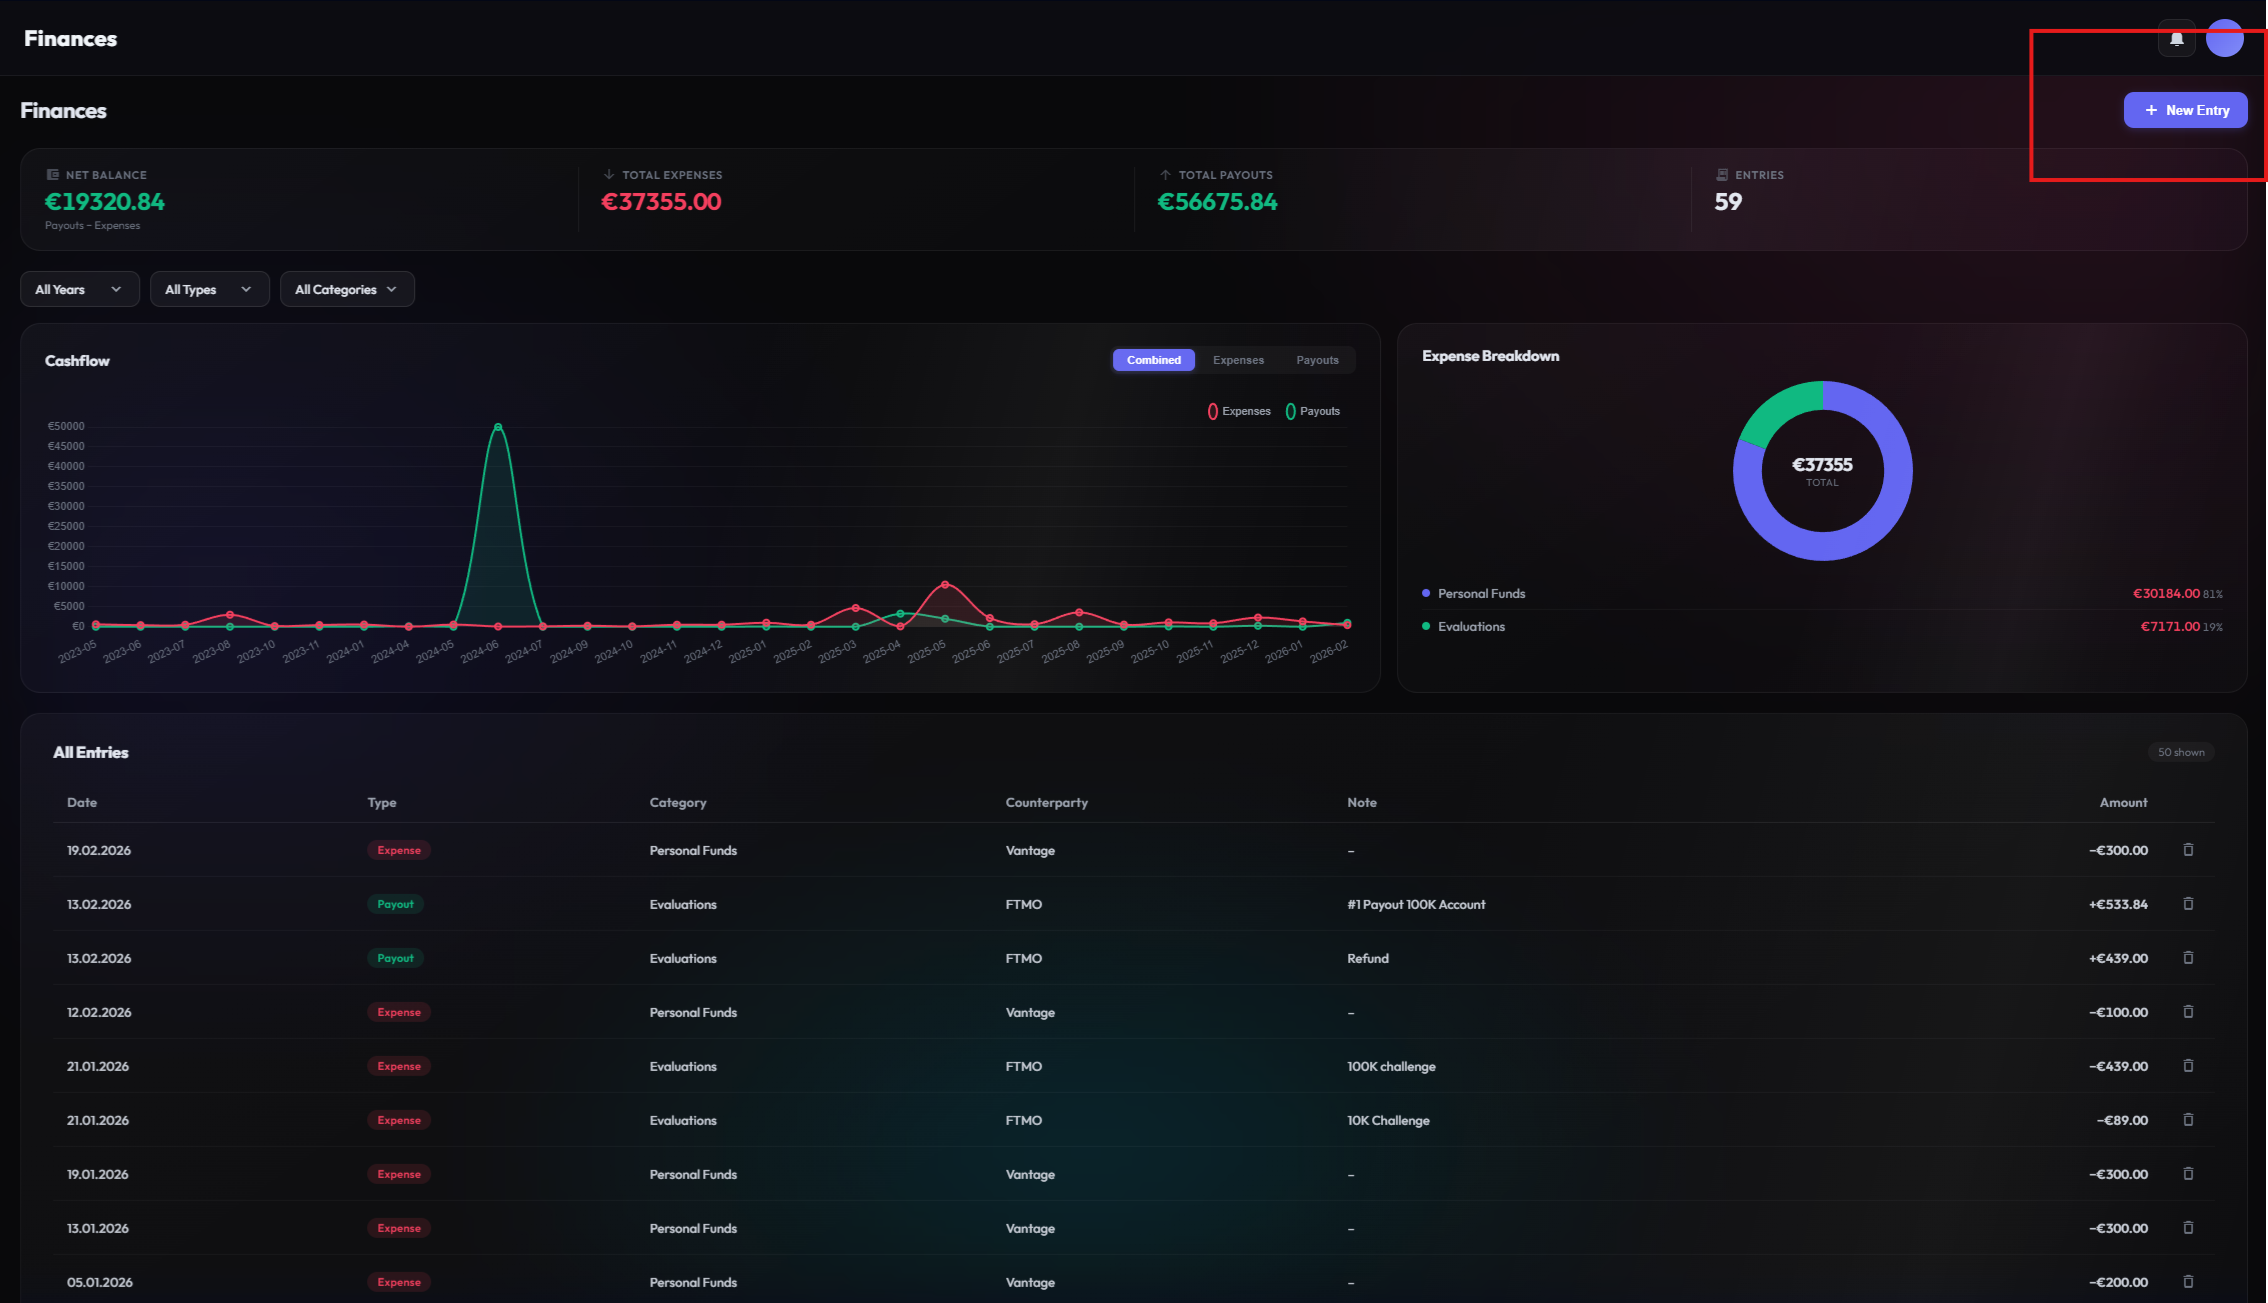
Finance Tracker
Treat trading like a business. The Finance Tracker gives you a total overview of your cash flow – beyond pure trade PnL.
Record all financial movements to determine your true net profitability:
Record Entries
Click the "Add Entry" button to log a new financial transaction. Each entry requires a type, amount, date, and optional description:
- Income: Record payouts from prop firms, profit withdrawals, or deposits into your trading accounts.
- Expenses: Track all costs: software subscriptions, data feeds, VPS hosting, courses, commissions, and platform fees.
- Recurring: Set up recurring entries for regular costs like monthly subscriptions so you never forget to log them.
Categories & Overview
All entries are automatically categorized and displayed in a clear dashboard. See your total income vs. expenses at a glance, broken down by month. This helps you understand your true cost of trading and whether your business is actually profitable after all expenses.
Manage Documents
Attach receipts, invoices, and contracts directly to each financial entry. No more digging through emails or folders – everything is stored alongside the transaction it belongs to. This keeps your records organized and audit-ready.
Log expenses consistently, even small ones. Costs like data feeds, VPS, and educational material add up quickly. Knowing your exact breakeven point helps you set realistic profit targets.
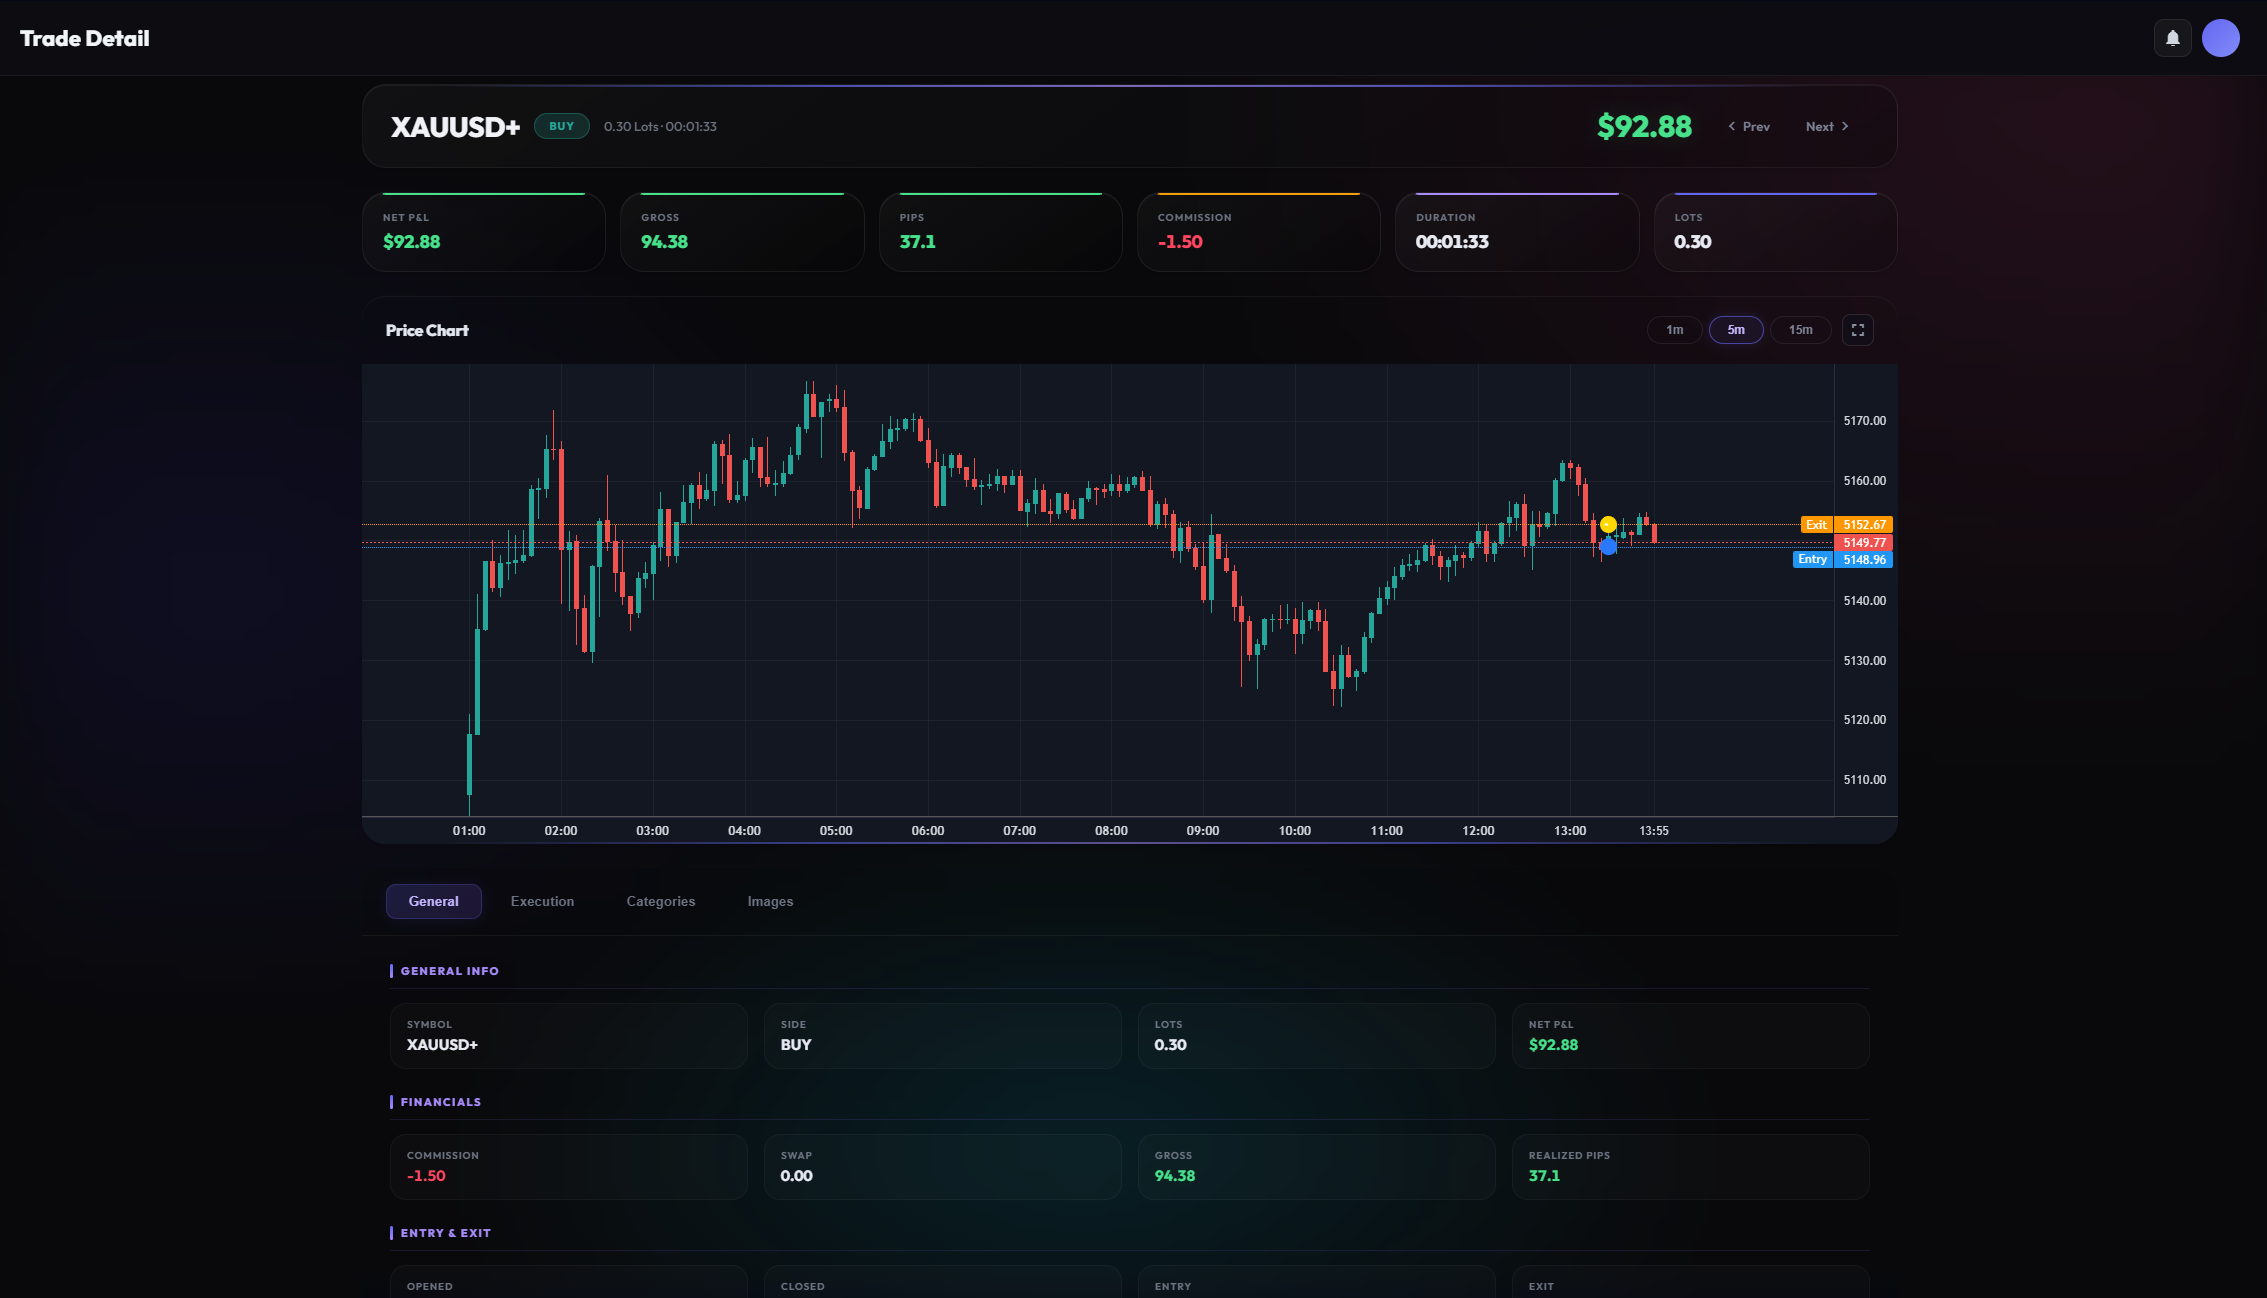
Trade Details
The truth lies in the detail. Dive deep into every single trade to perfect your decision-making.
The detail view is divided into several areas:
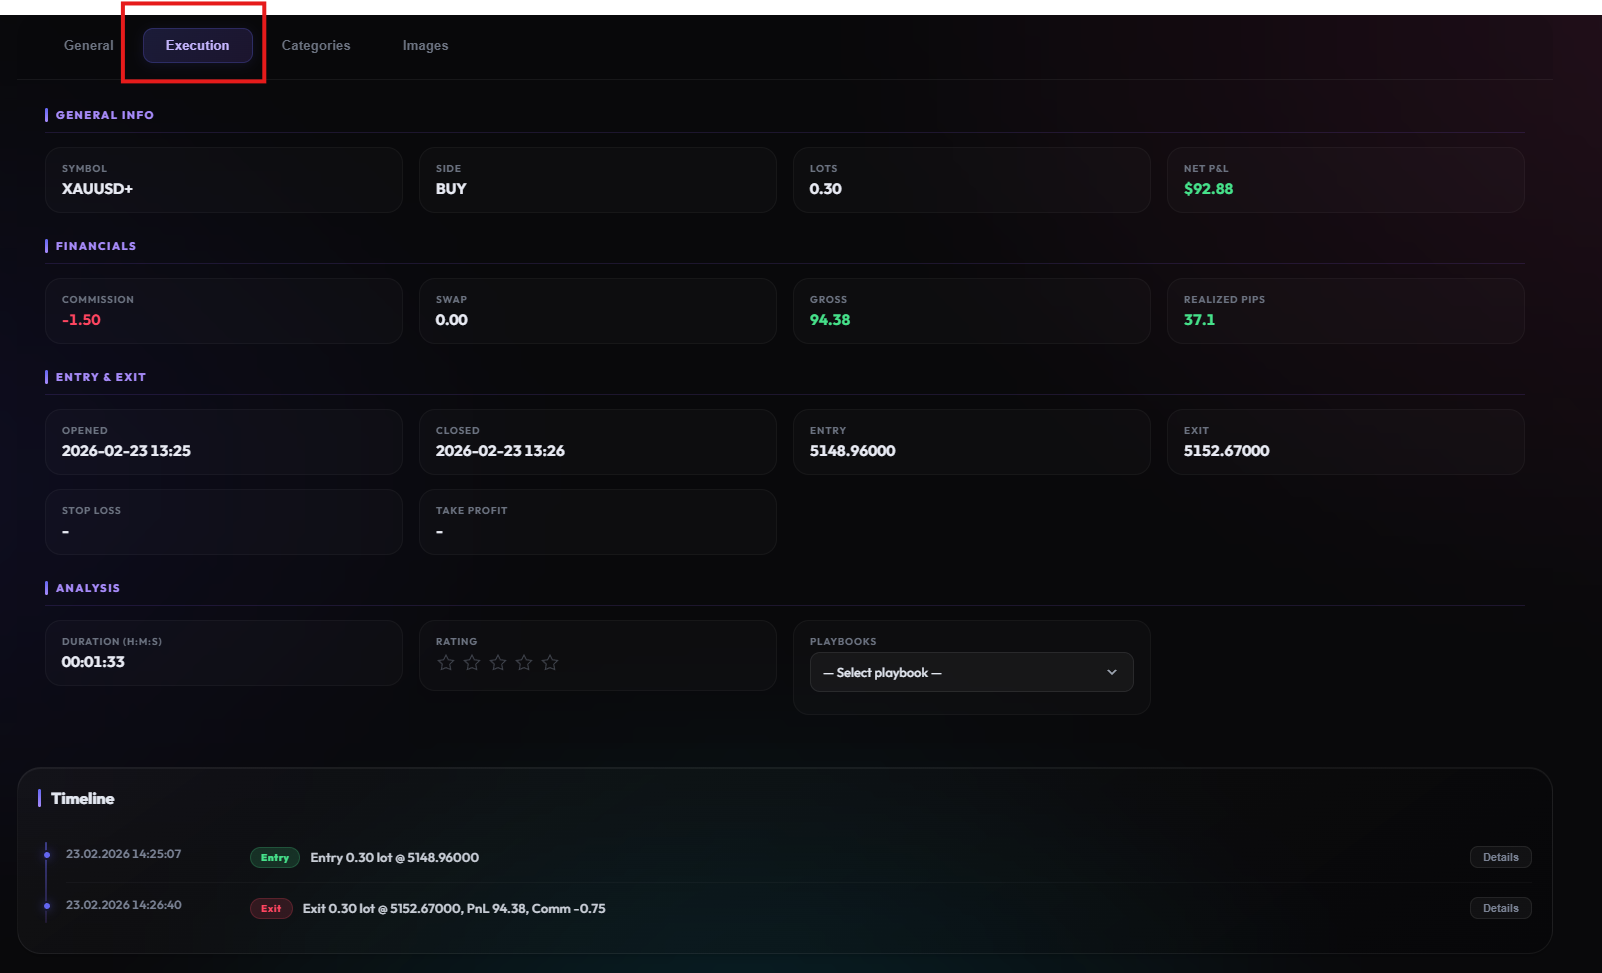
Executions
Every partial entry and exit is recorded with exact timestamps, prices, and volumes. For scaled entries or partial take-profits, you'll see each individual execution as a separate row. This transparency helps you evaluate your timing and execution quality.
Categories & Rating
Rate every trade with setup quality (A/B/C), emotional state, and custom categories. Over time, this subjective data becomes incredibly valuable: you'll discover that your "A-setups" have a significantly higher win rate, or that trading when frustrated leads to consistent losses.
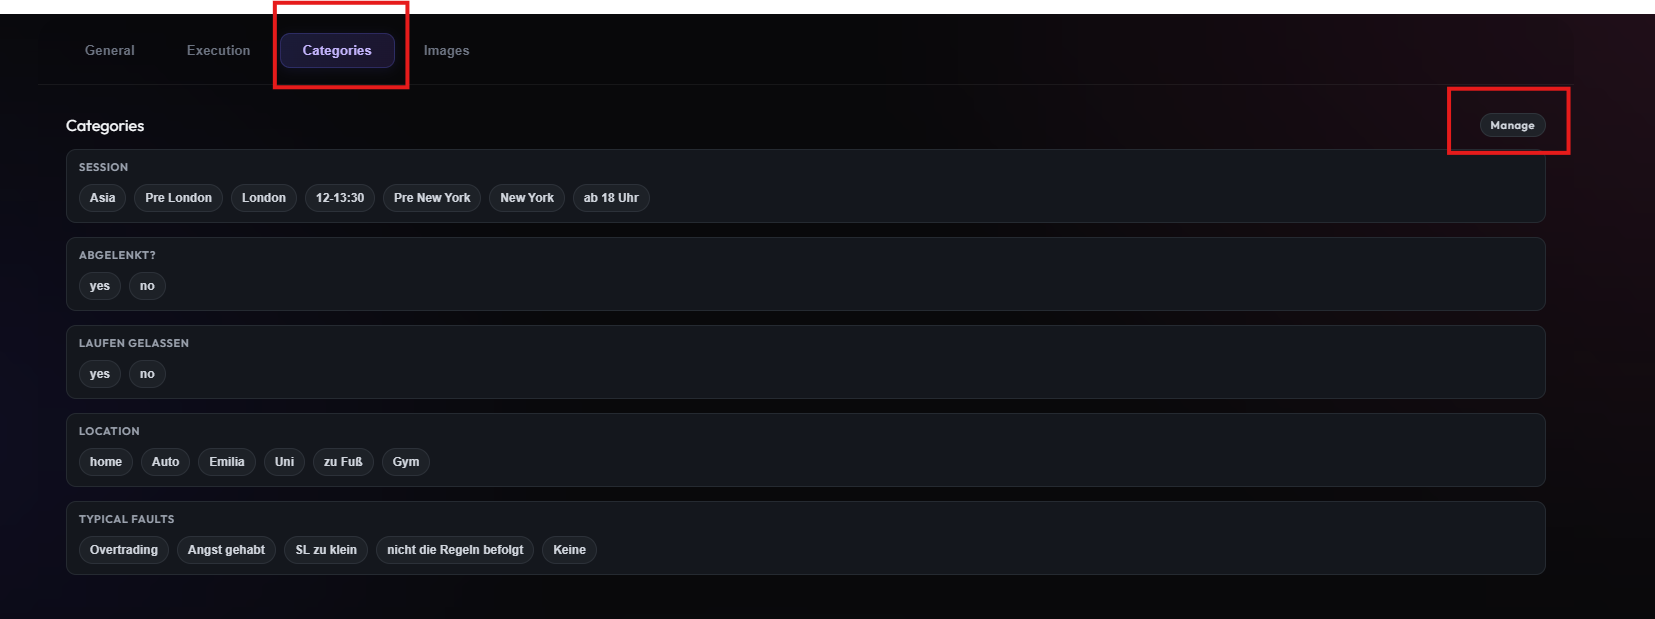
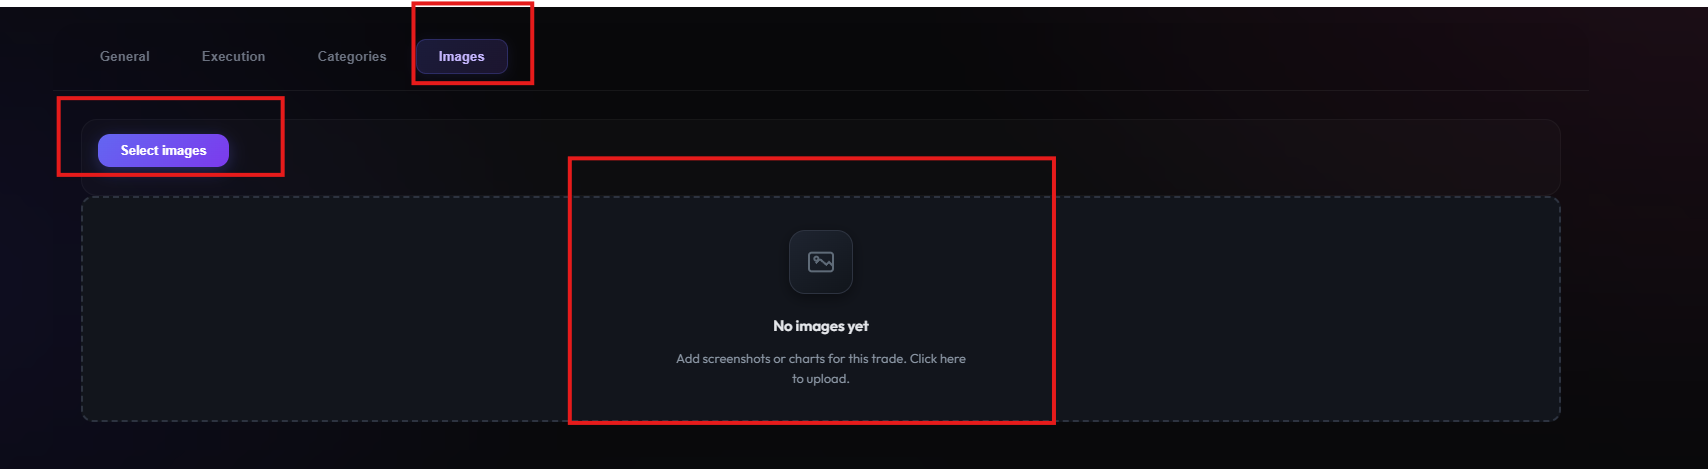
Chart Images
Attach chart screenshots directly to each trade. Upload multi-timeframe analyses, annotated setups, or before/after comparisons. Visual documentation makes your trading journal infinitely more useful during review sessions.
Our interactive Execution Chart is in development. It will visualize your entries and exits directly on a price chart, making trade review even more intuitive.